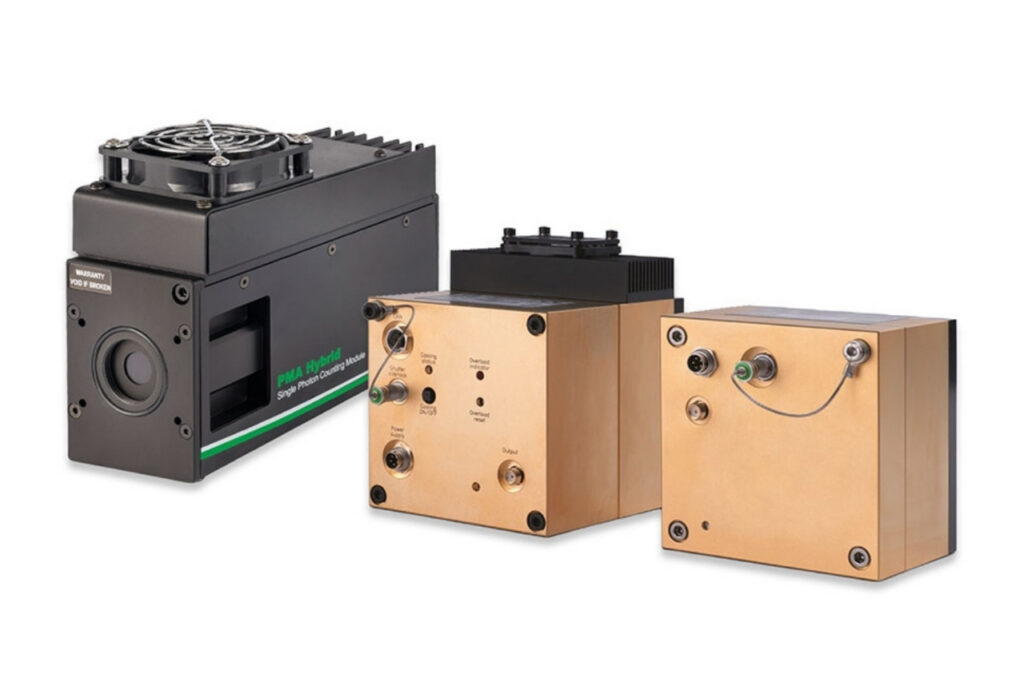
Photon Counting Detectors
High-performance SPAD, PMT and hybrid detectors for reliable photon counting across materials science, life science, quantum optics, and metrology.
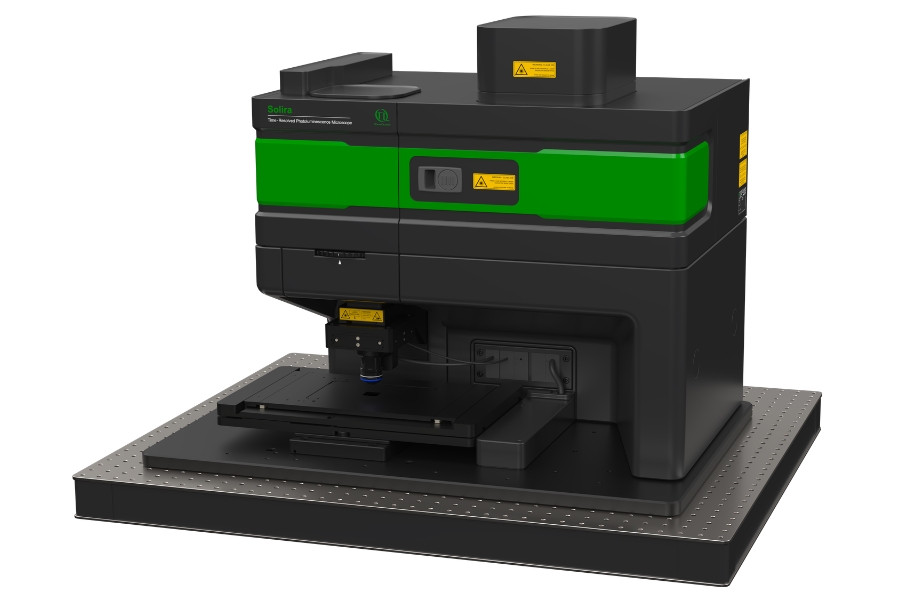
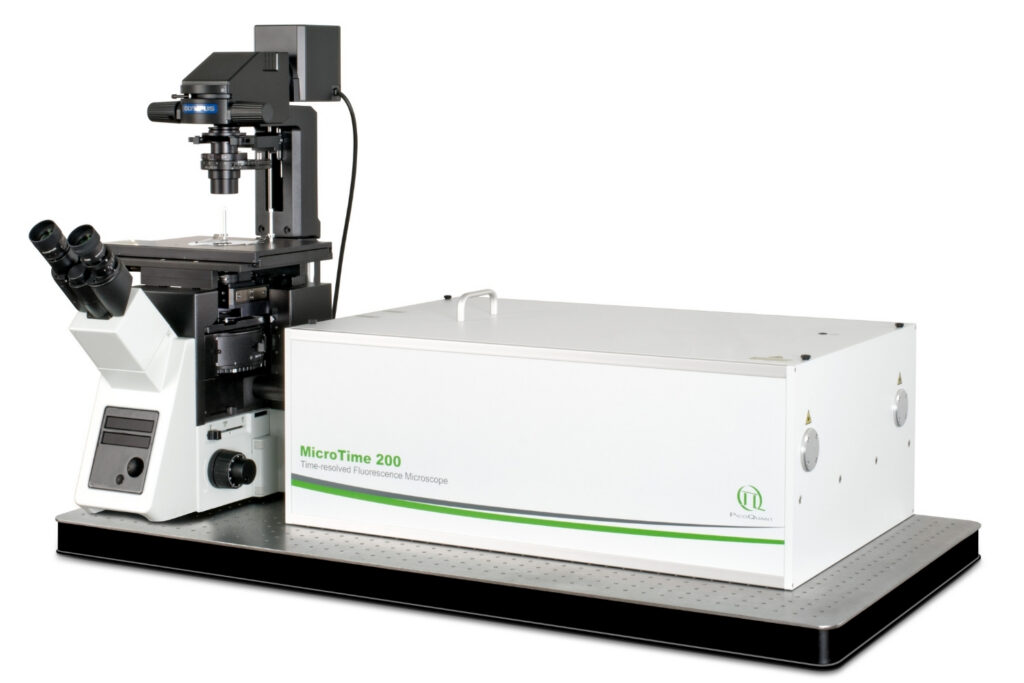
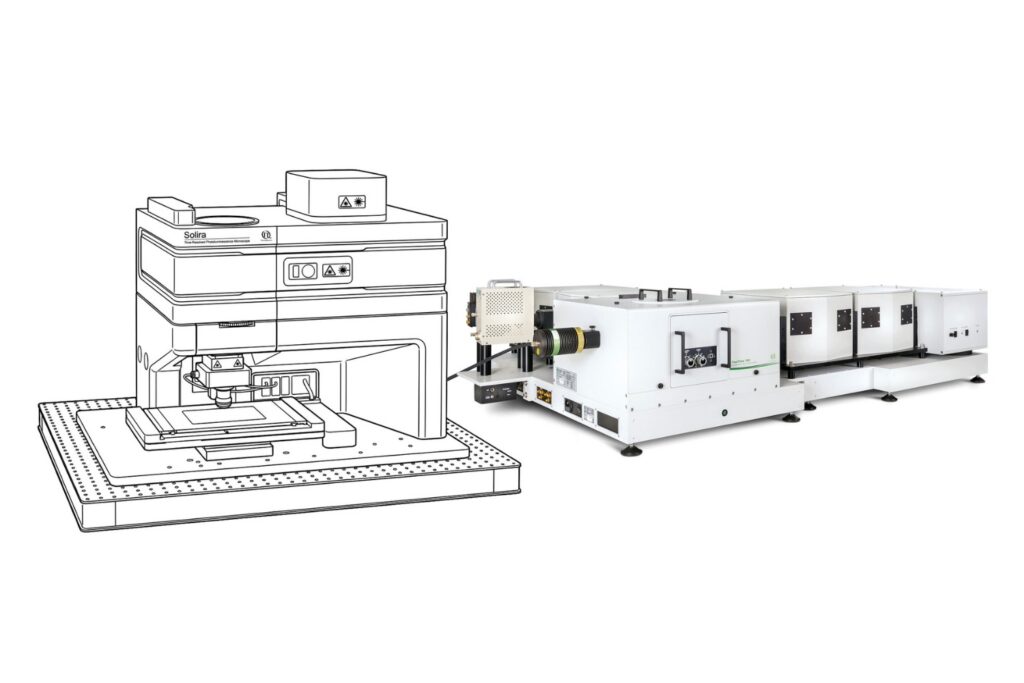
Simplify your materials characterization with one flexible TRPL microscope enabling multiple methods for precise and efficient analysis.
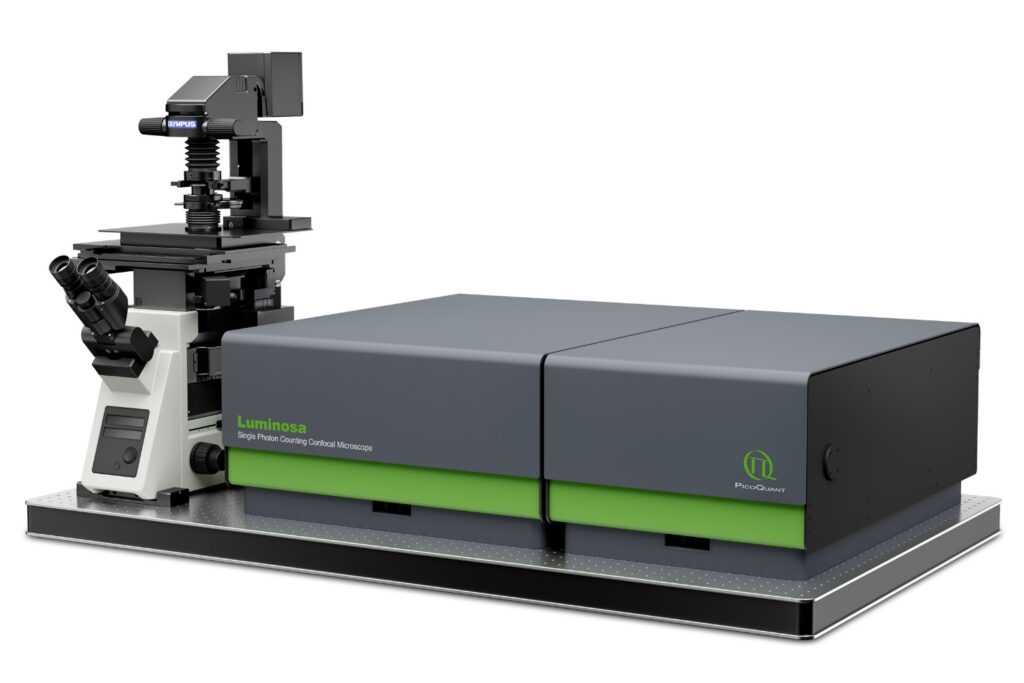
Complete confocal fluorescence microscope that empowers researchers to advance quantitative functional imaging from individual molecules to cells and tissues.
Compact FLIM and FCS upgrade kit that adds advanced functional imaging and correlation analysis to existing laser scanning microscopes.
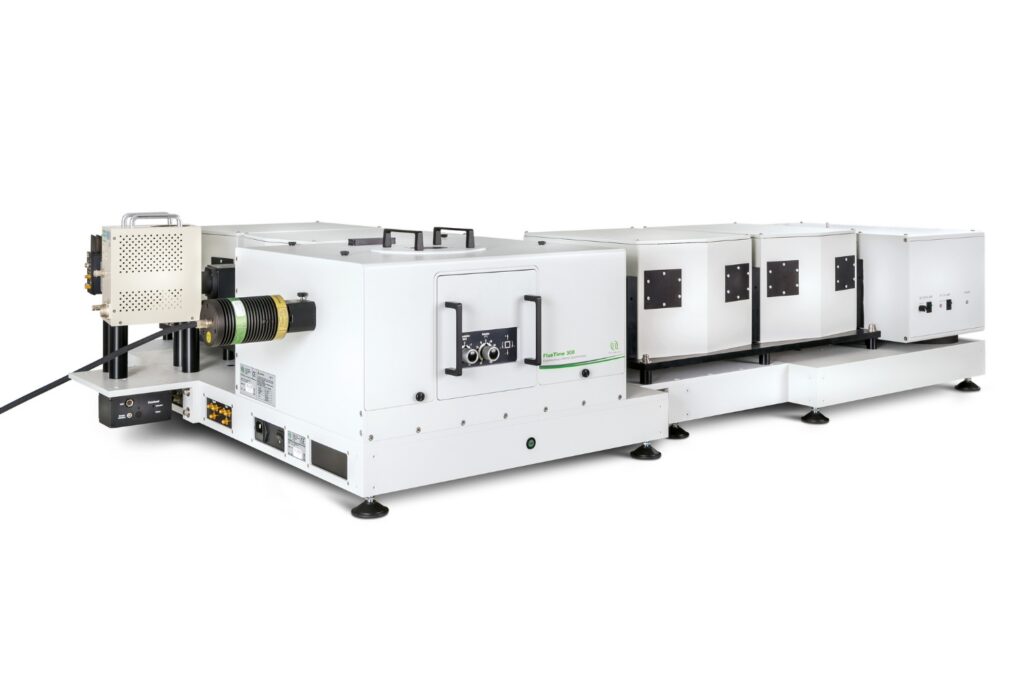
Designed for flexible, sensitive, and precise steady-state and time-resolved spectroscopy across the UV to NIR range and time scales from picoseconds to milliseconds.
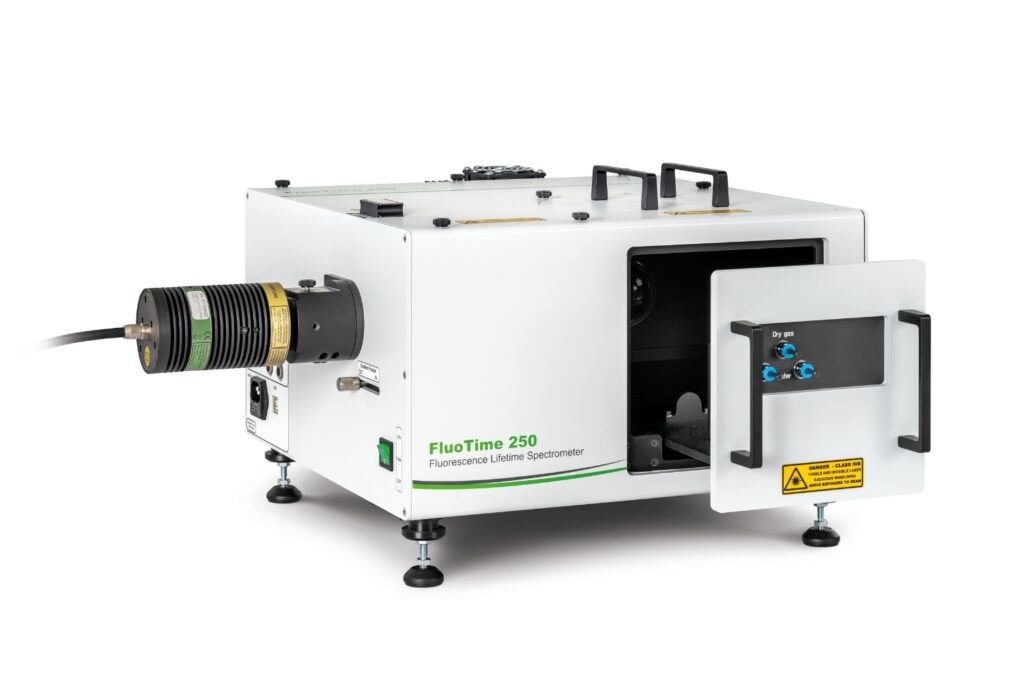
Modular lifetime spectrometer designed for flexible fluorescence and photoluminescence measurements in both materials and life science research.
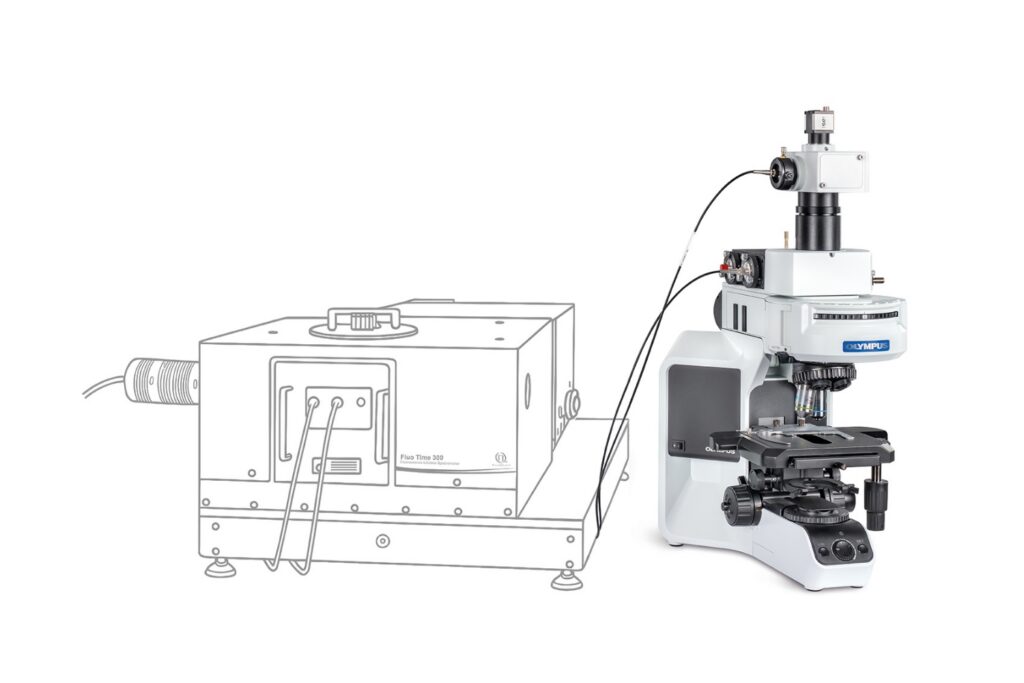
Add spectral and time-resolved photoluminescence to your setup through flexible microscope–spectrometer coupling options.
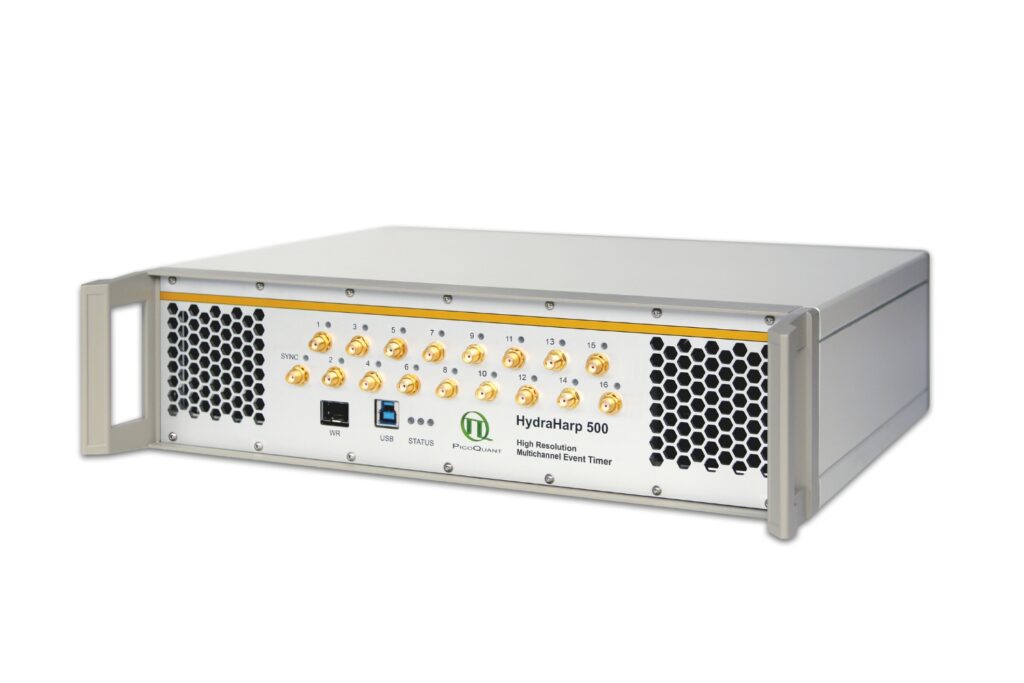
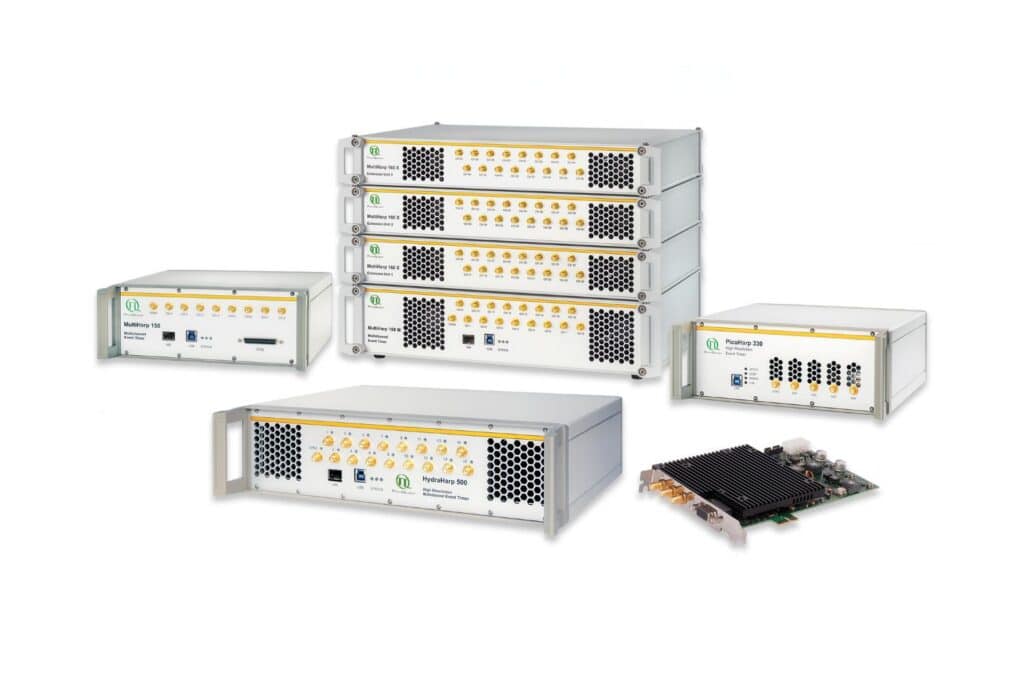
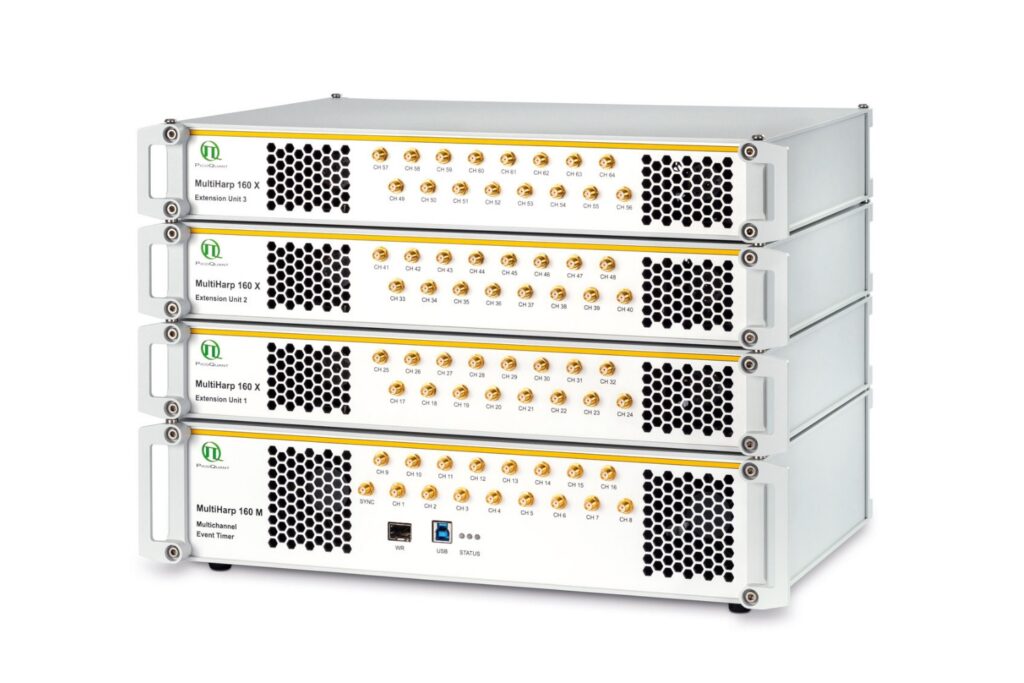
Get the most out of superconducting nanowire detectors in large-scale quantum communication and computing experiments requiring precise multichannel timing.
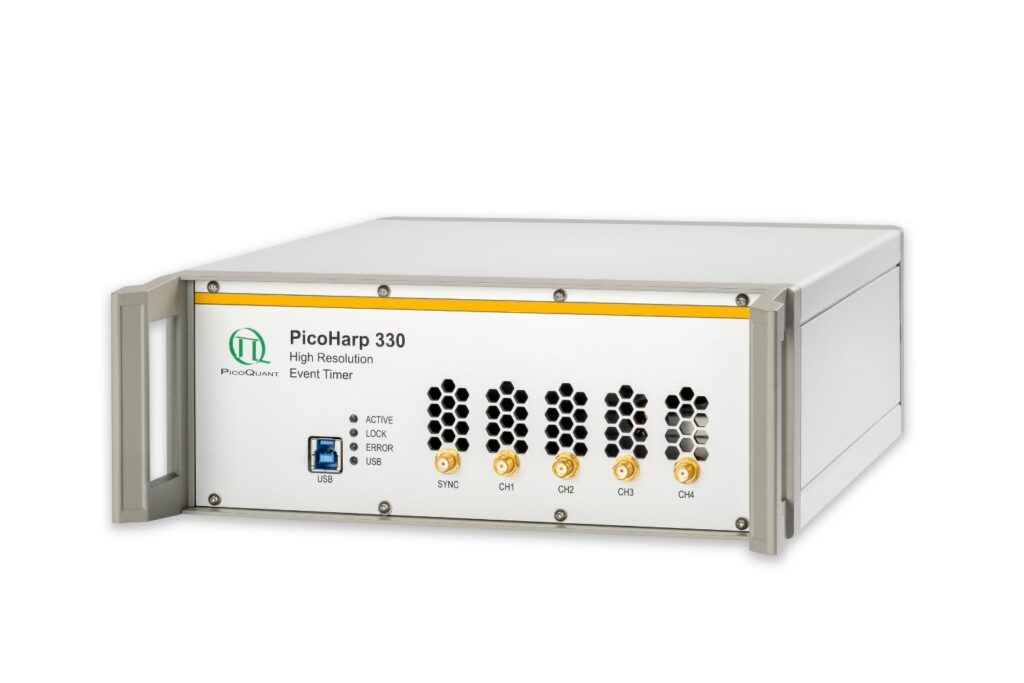
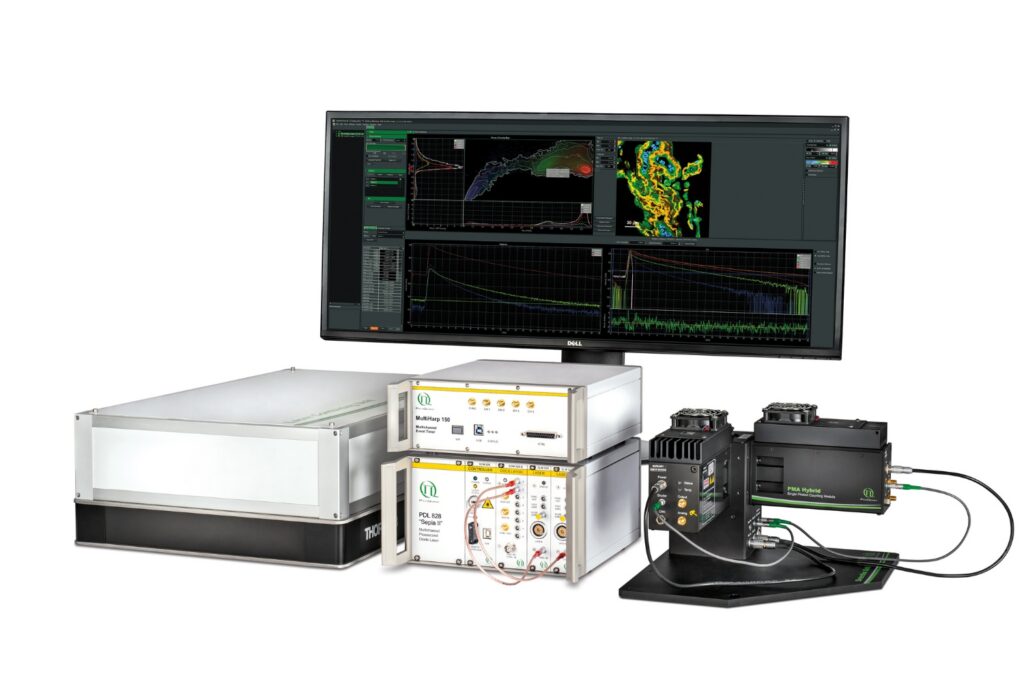
Boost your time-resolved experiments with a flexible, high-precision time tagging and TCSPC unit for materials science and quantum sensing.
Scale your photonic quantum computing and detector characterization setups while maintaining performance, flexibility, and high data throughput.
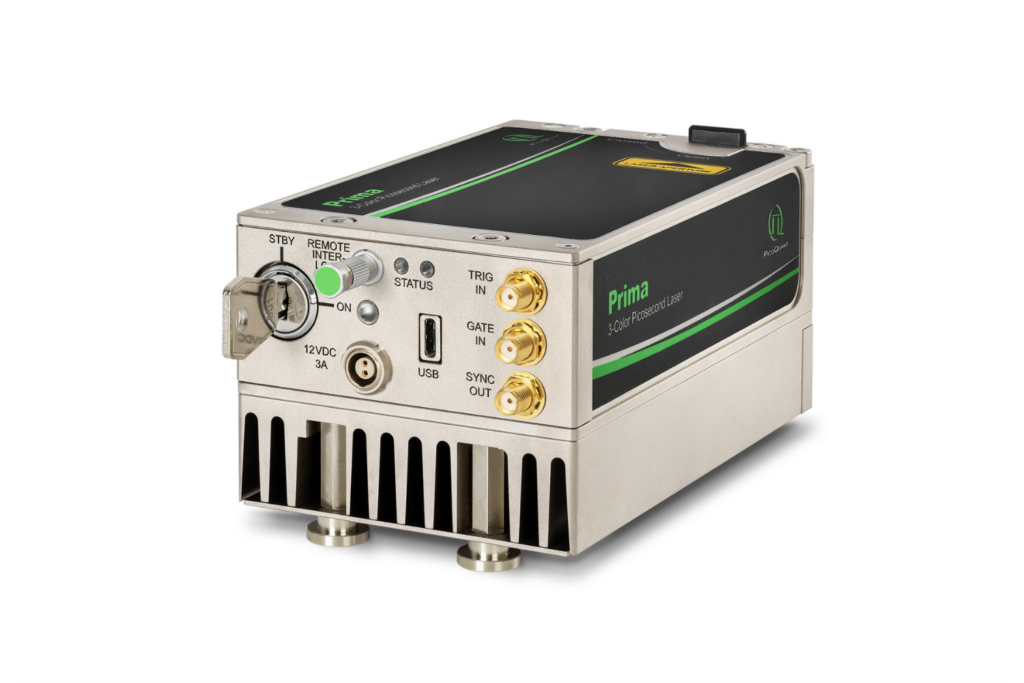
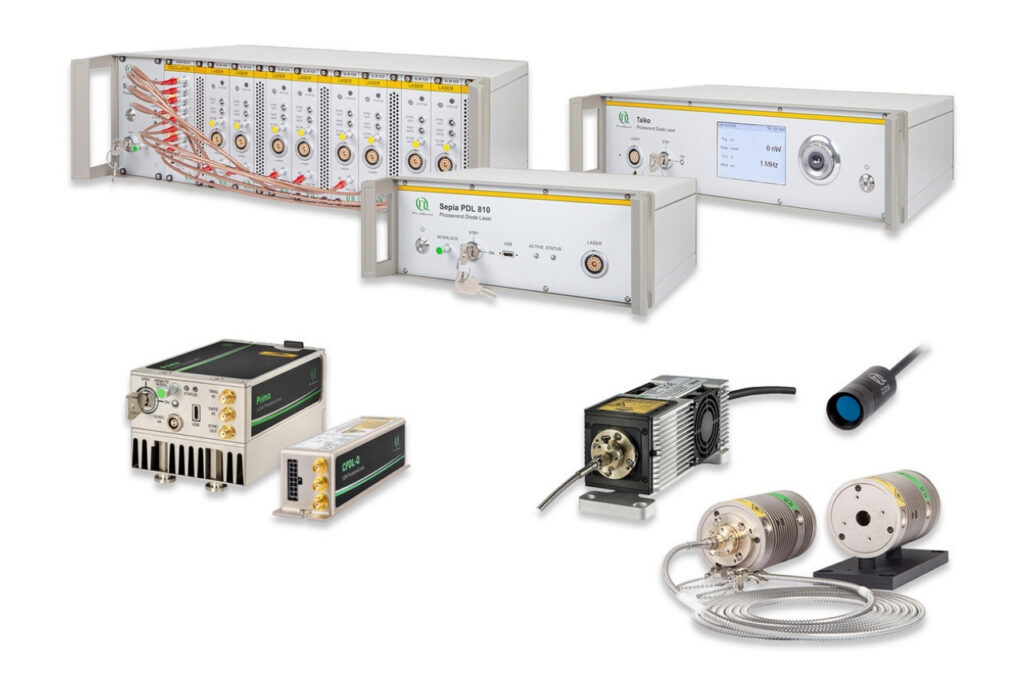
Compact 3-color picosecond laser delivering flexible ns to ms excitation with cost-effective multicolor performance and straightforward operation.
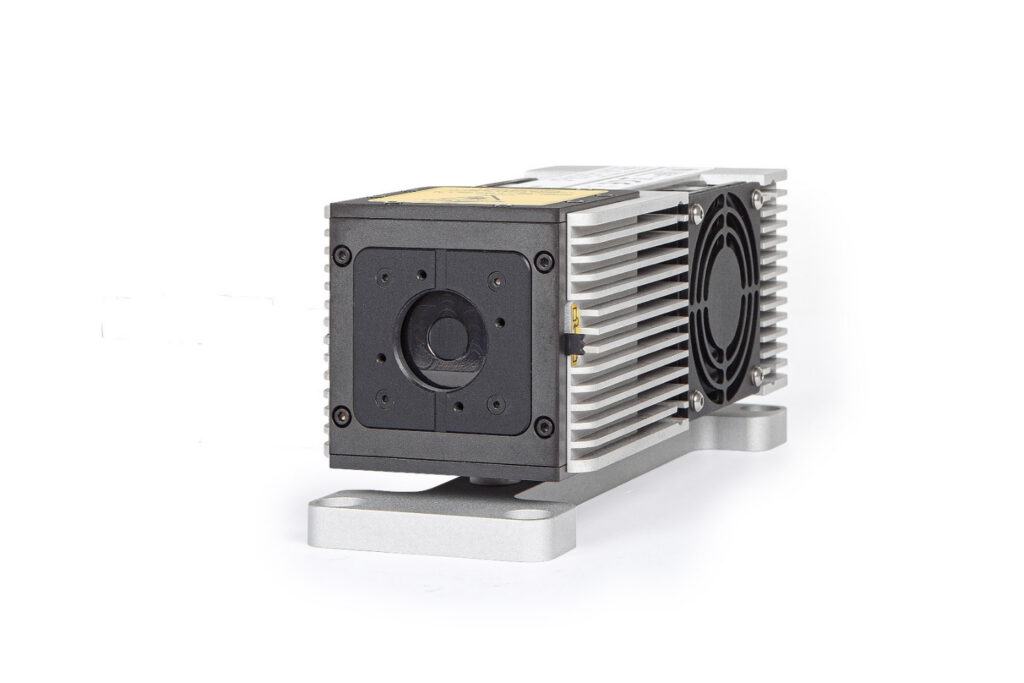
Smart picosecond laser diode heads covering UV-A to NIR, providing the right combination of power, pulse width, and diode type for any time-resolved technique.
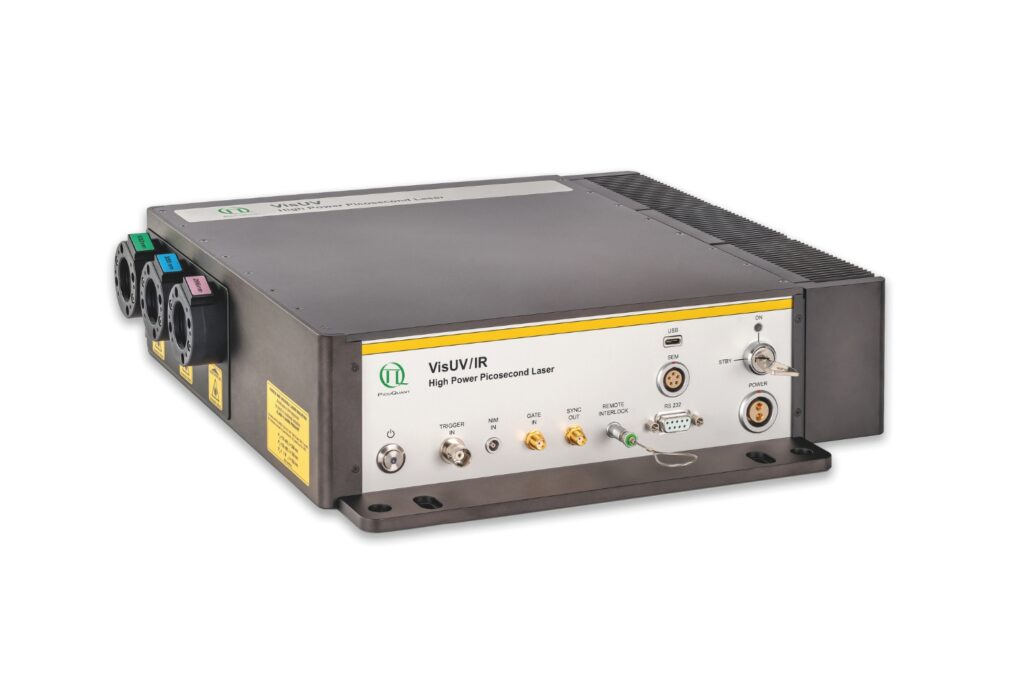
VisUV provides clean short pulses and stable timing across key UV and visible wavelengths, including deep UV lines as well as 488 nm and 532 nm.
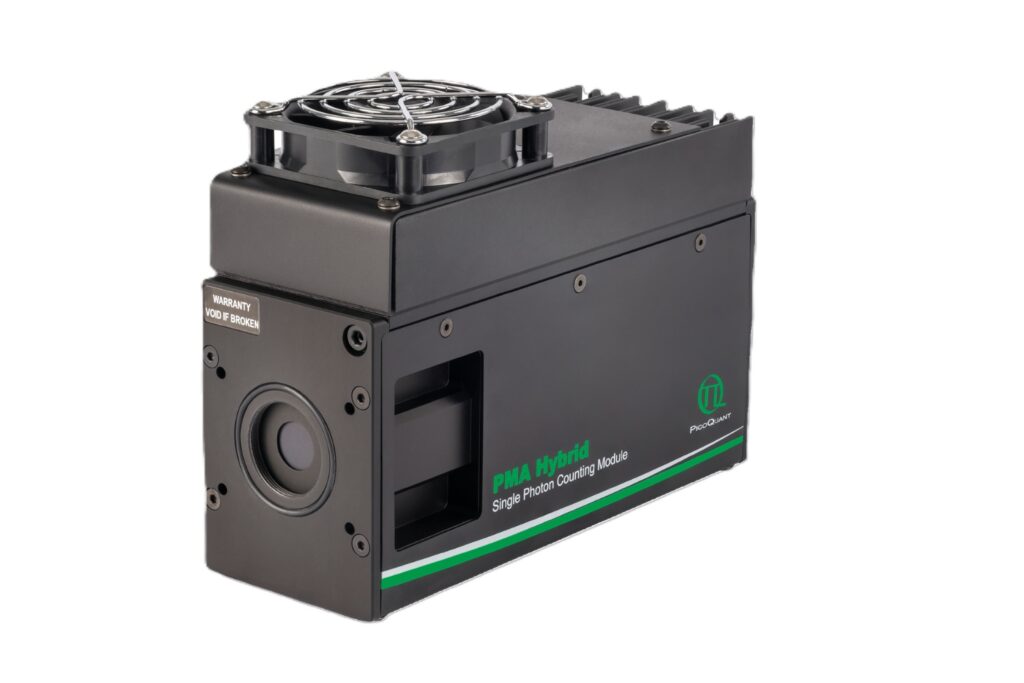
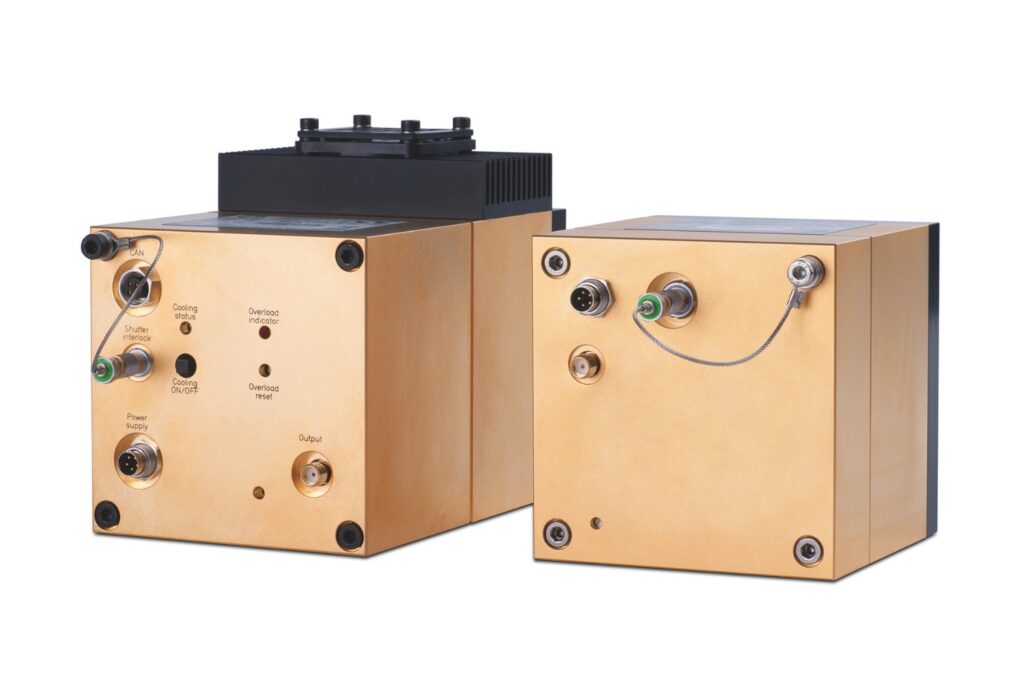
Enhance your single-photon counting experiments with wide dynamic range and excellent timing precision in the UV and visible even at the highest count rates.
Capture even the weakest signals over large areas with maximum dynamic range and enhanced low-light sensitivity in a compact detector design.
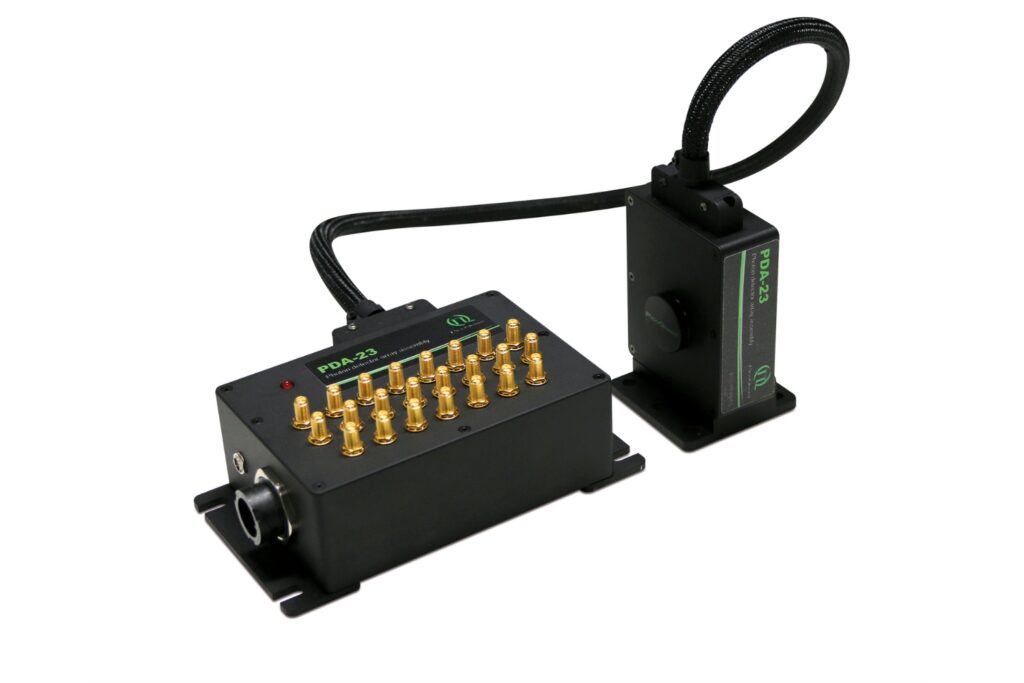
Unlock spatially resolved single-photon detection with a 23-pixel SPAD array, combining low dark counts and precise time tagging for advanced experiments.
Advanced FLIM analysis software for fast, accurate interpretation of lifetime imaging data.
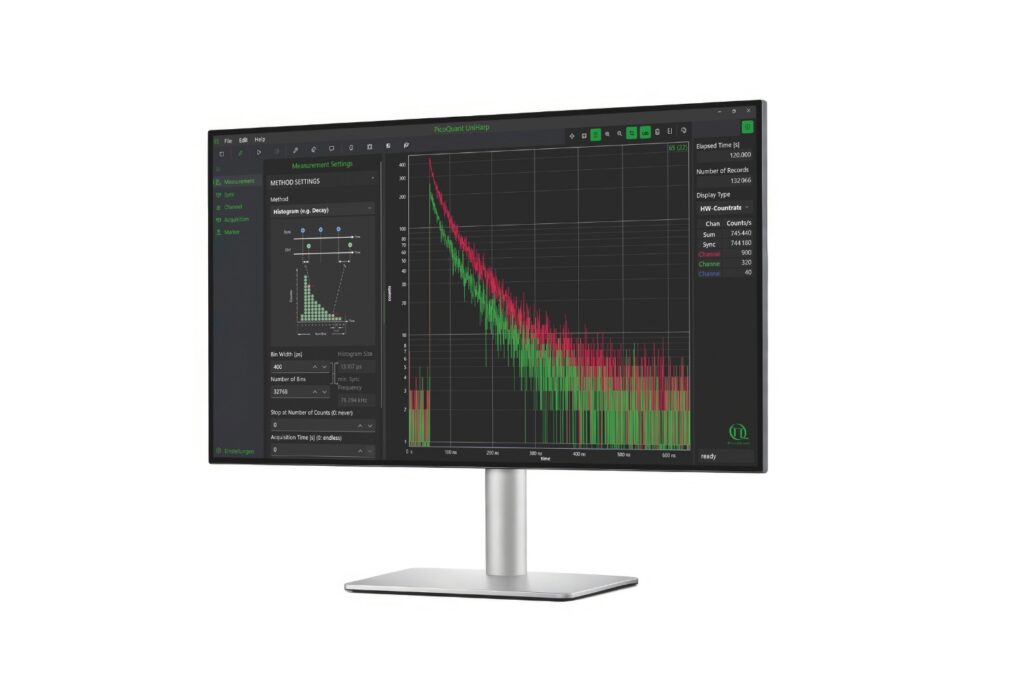
Intuitive, free software solution for real-time, high-precision photon data acquisition, visualization, and initial data analysis.
Advanced software for time-resolved fluorescence acquisition and analysis.
An imaging technique that uses fluorescence lifetimes to generate image contrast.
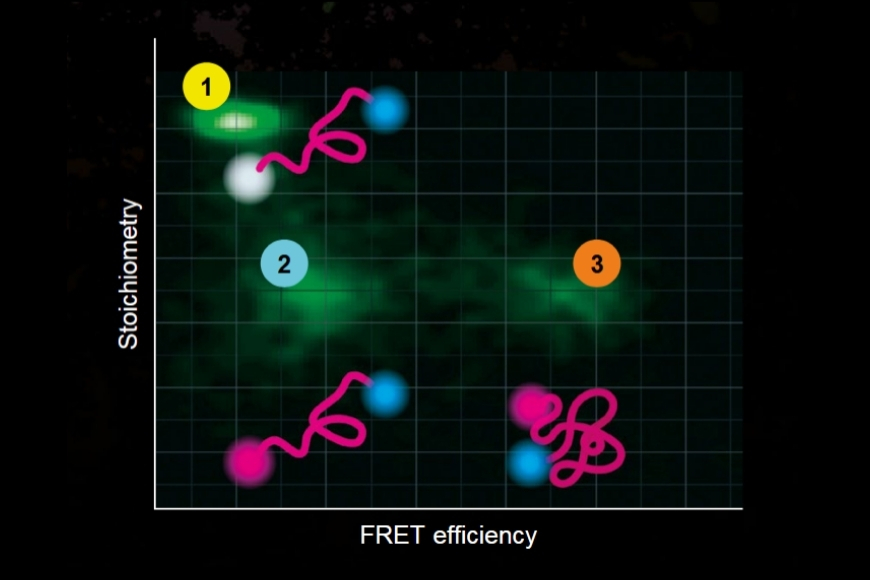
Investigating how proteins dynamically explore multiple conformational states that control biological function.
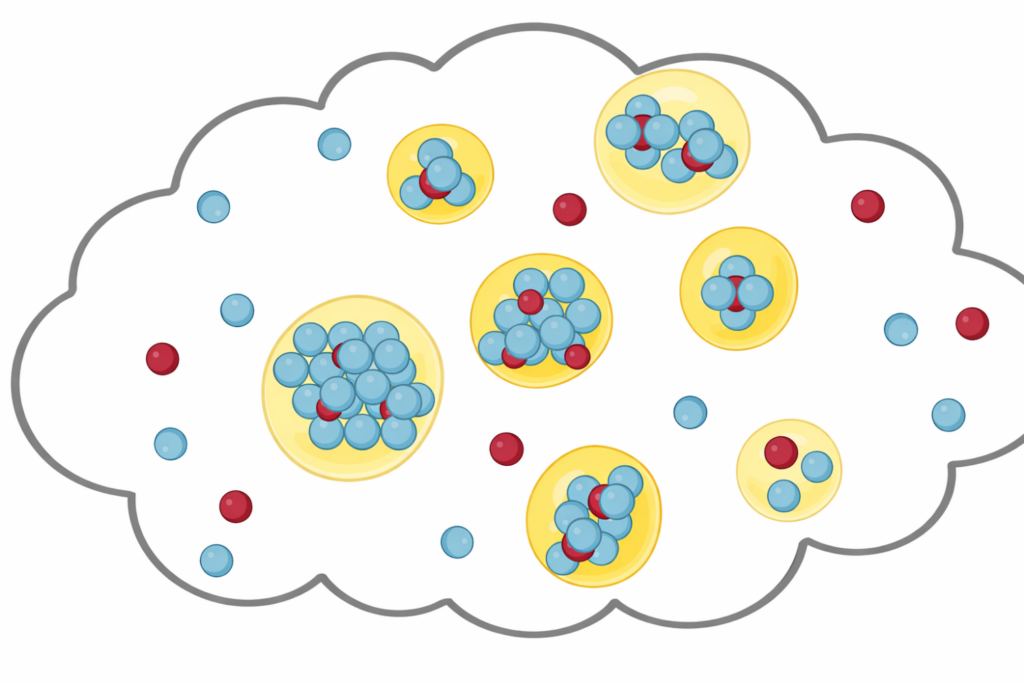
Investigating how biomolecules separate into dynamic liquid phases to organize cellular space and regulate biological function.
A time-resolved technique that measures photoluminescence lifetimes to reveal excited-state dynamics in materials.
Studying exciton dynamics, charge carrier processes, and structural properties through optical and time-resolved characterization methods.

Investigating charge-carrier lifetimes and recombination dynamics to enable precise optical characterization of material quality and device performance.
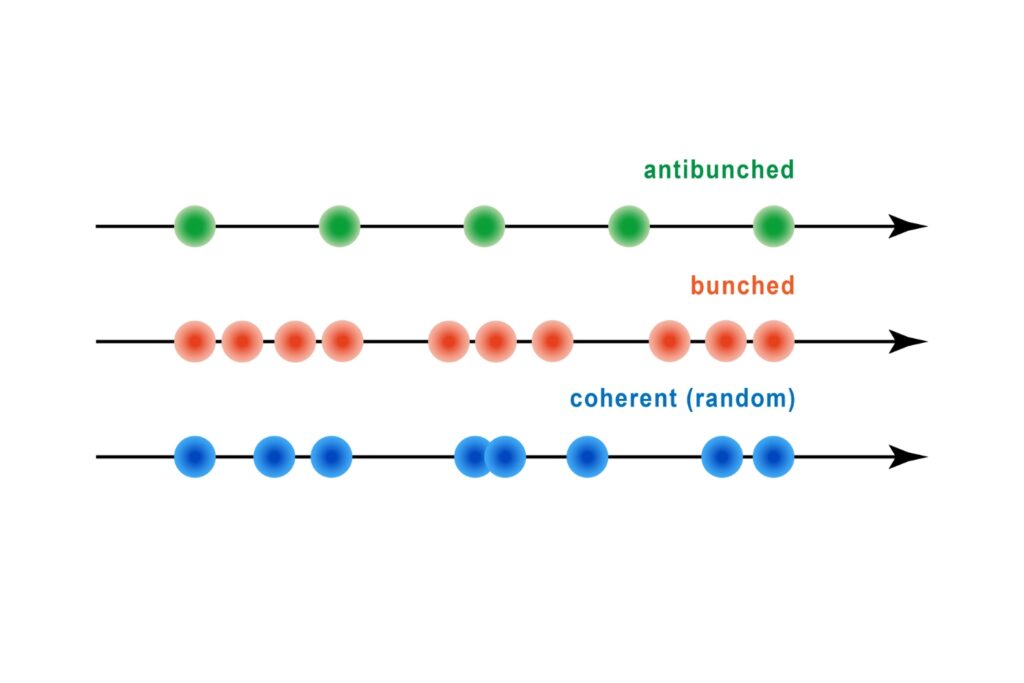
A quantum optical signature revealed by time-resolved photon correlation analysis to identify single-photon emission in materials and nanostructures.
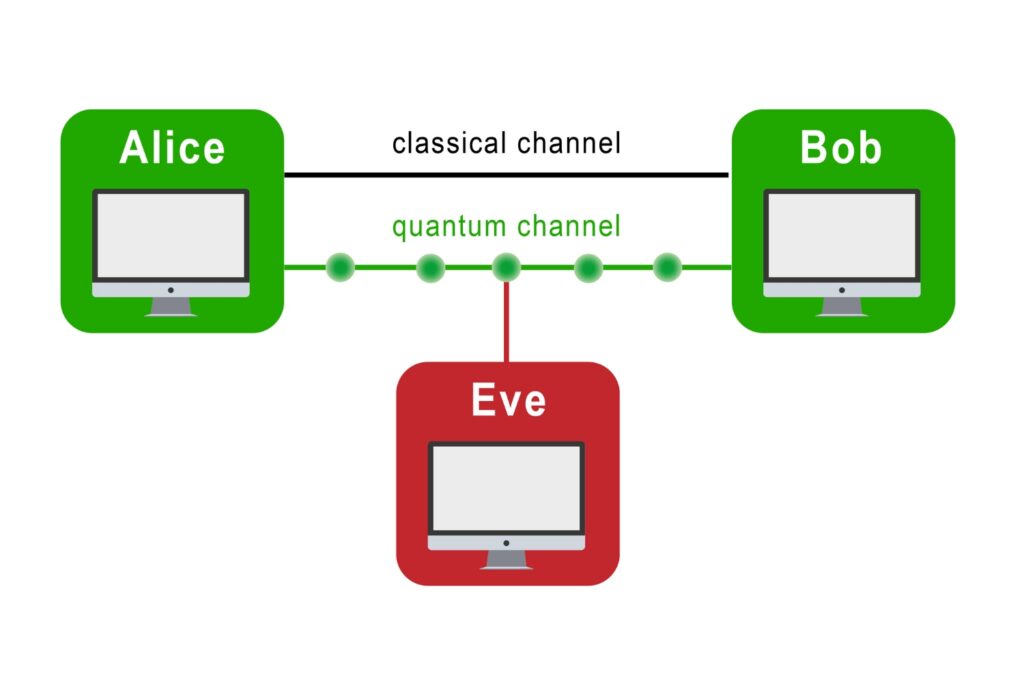
The transmission of information using individual photons, using quantum effects to ensure absolute security.
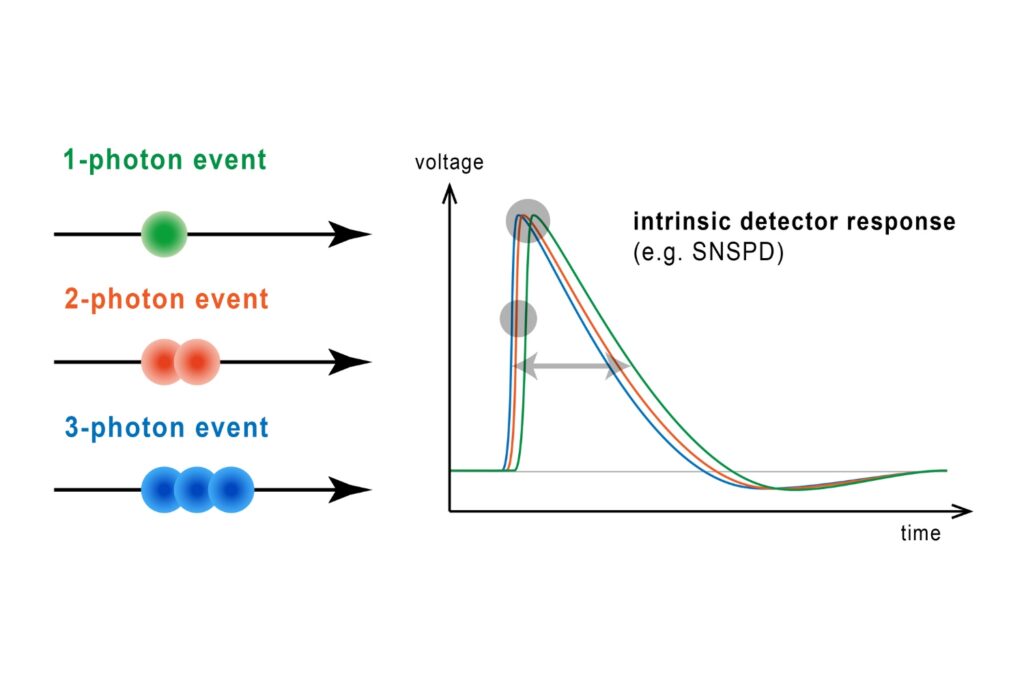
Quantifying photons per detection event enables direct access to photon-number statistics, providing insight into quantum and statistical properties of light.
An optical technique that analyzes light emission under electrical excitation to reveal electronic properties of electroluminescent materials.
Monitoring environmental signals and trace compounds to understand dynamic changes in natural and engineered environments.
A photon timing technique that measures single-photon arrival times to resolve ultrafast dynamics in fluorescence, materials research, and quantum optics.
A fluorescence lifetime refers to the average time a molecule remains in its excited state before emitting a photon and returning to the ground state, typically ranging from a few hundred picoseconds to several nanoseconds, depending on the molecular environment. Fluorescence Lifetime Imaging Microscopy (FLIM) is an advanced fluorescence imaging technique that maps the spatial distribution of fluorophore lifetimes in a sample. Unlike conventional fluorescence microscopy, which relies on signal intensity or spectral information, FLIM generates image contrast from this time-resolved parameter.
As fluorescence lifetime is largely independent of fluorophore concentration, excitation power, and photobleaching, FLIM enables robust and quantitative measurements. Moreover, since lifetime is sensitive to environmental factors such as pH, ion concentration, or molecular interactions, FLIM can reveal functional biochemical information beyond what intensity-based methods provide.
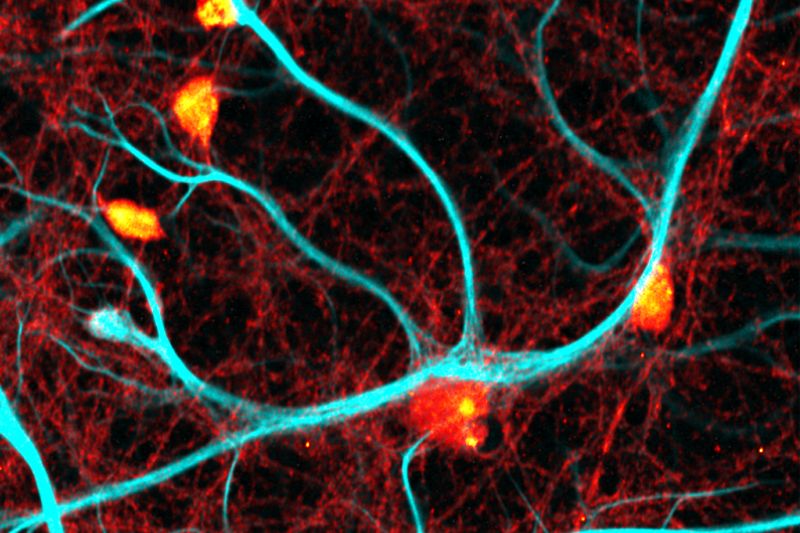
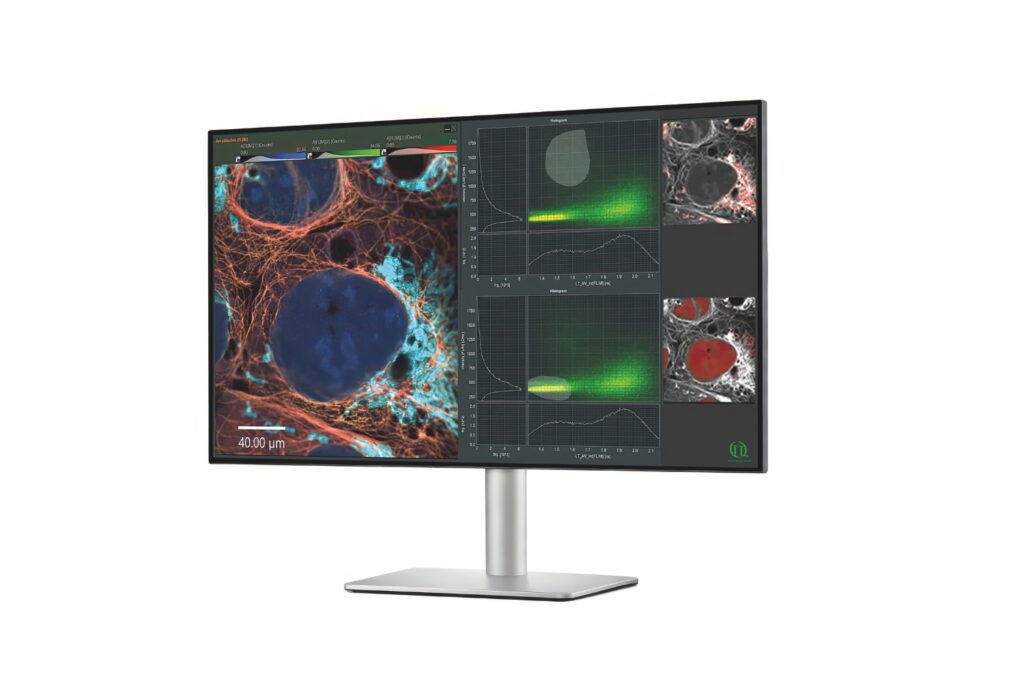
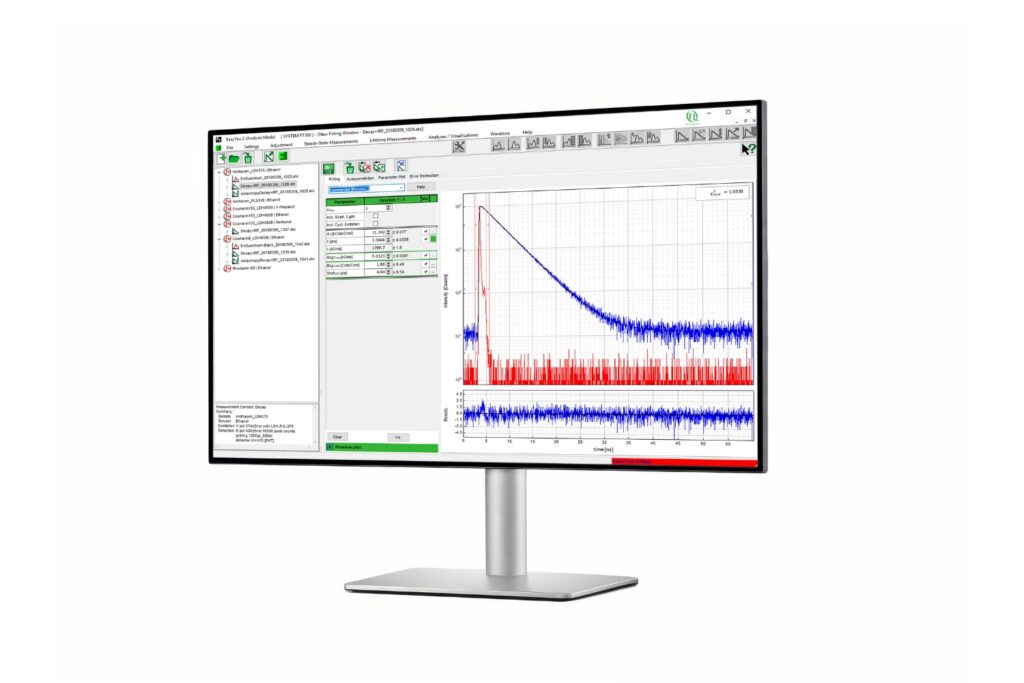
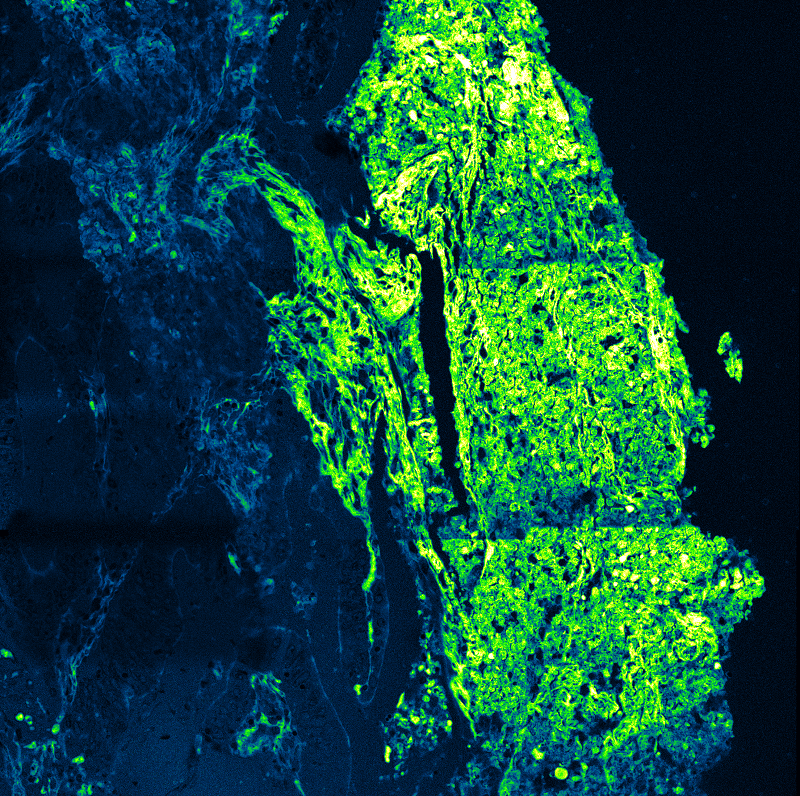
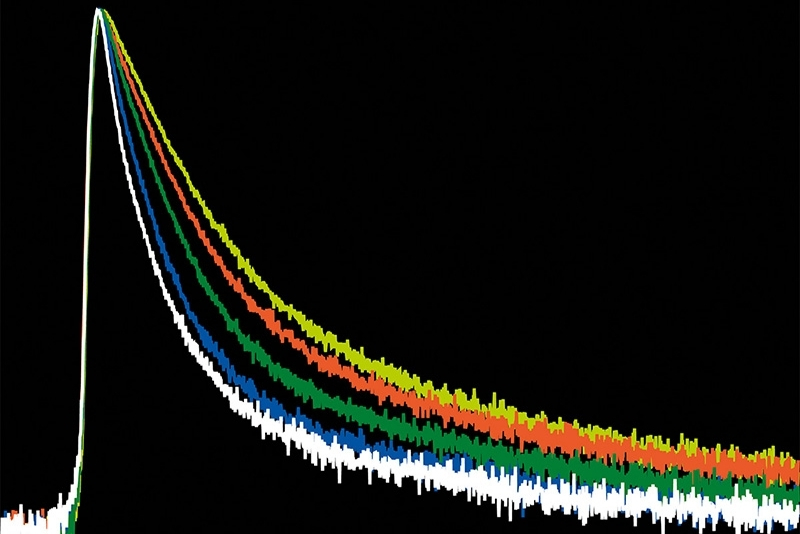
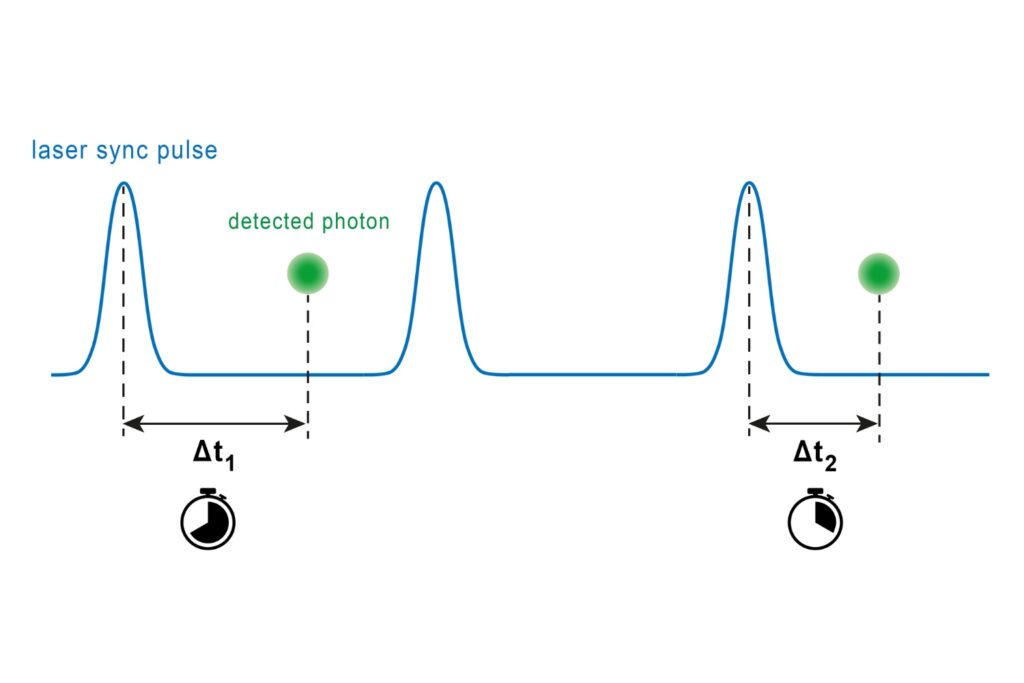
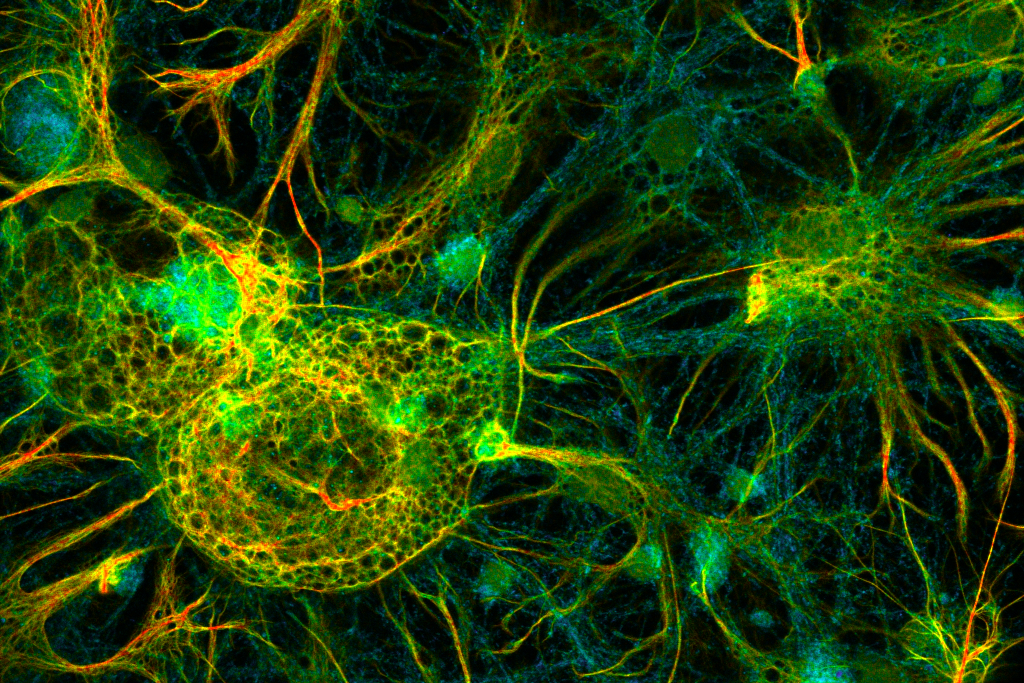 FLIM image of fixed primary neuronal cells stained for synapses (PSD95), intermediate filaments (GFAP), and mitochondria (TOM20). Sample courtesy of the Rizzoli Group, Department of Neuro- and Sensory Physiology, University of Göttingen Medical Center.
Fluorescence lifetime measurements in FLIM are commonly performed using time-correlated single photon counting (TCSPC). In this method, fluorophores are excited by short, repetitive laser pulses, and the arrival time of each emitted photon is recorded relative to the excitation pulse. Repeating this process over many cycles generates a histogram of photon arrival times at each pixel, where photon counts are accumulated into discrete time bins with picosecond resolution. This histogram represents the fluorescence decay profile.
This decay curve is typically fitted with a mono- or multi-exponential model to extract one or more fluorescence lifetime components. The resulting data yield a spatially resolved lifetime map with nanosecond-scale temporal sensitivity.
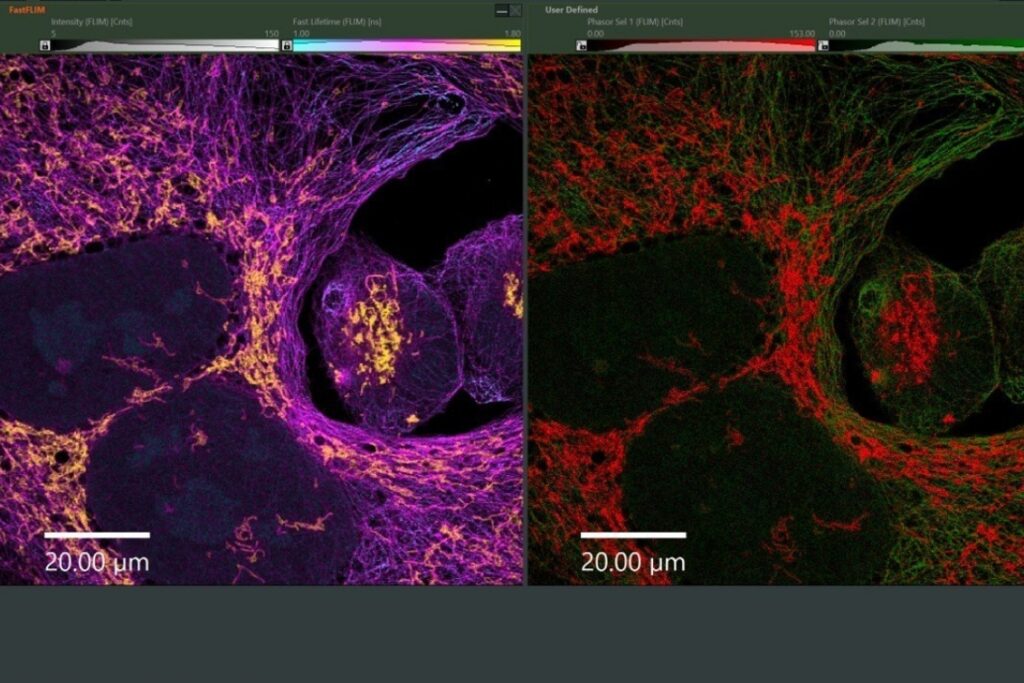
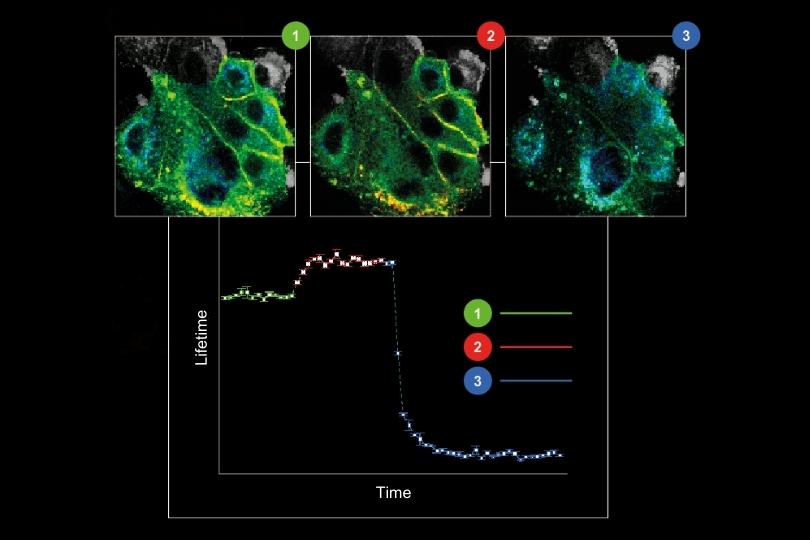
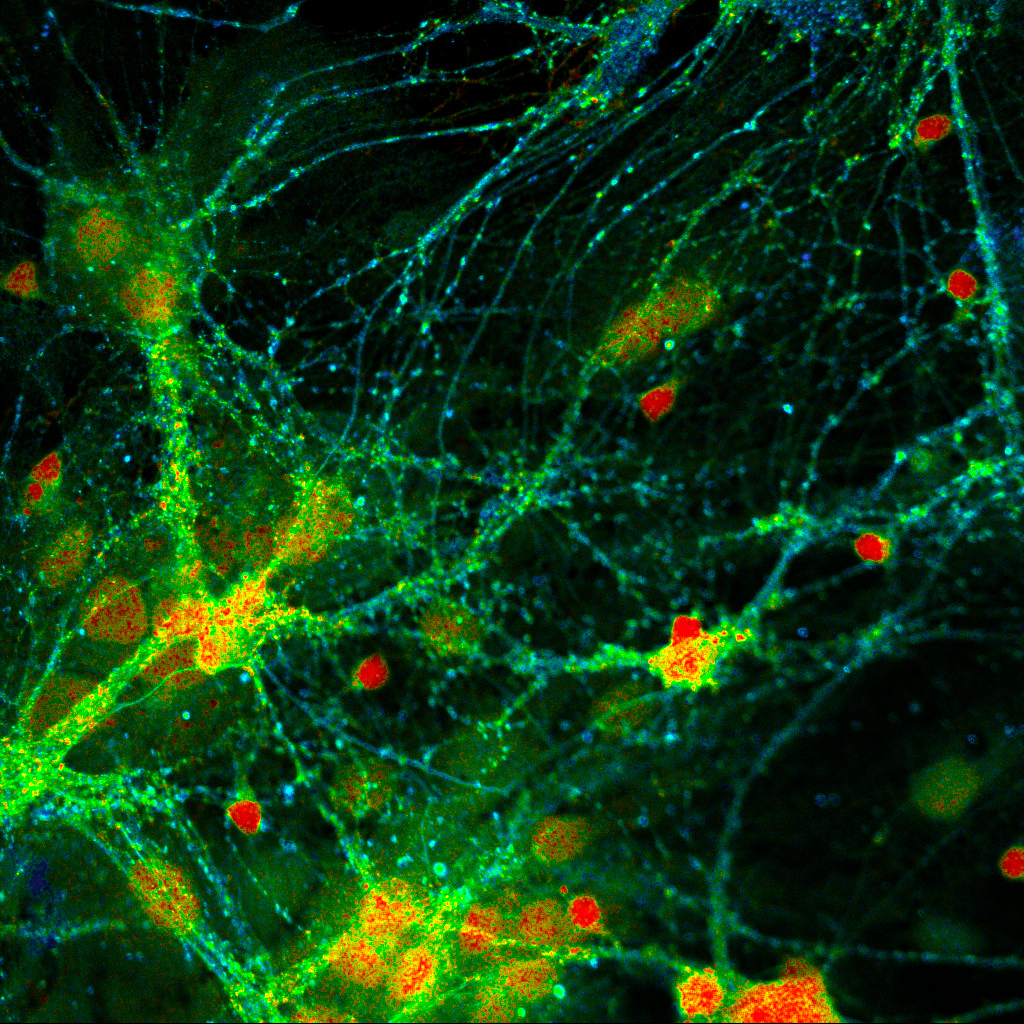 Presynaptic Bassoon and postsynaptic Homer clusters in fixed neurons visualized by fluorescence lifetime imaging (FLIM), where color encodes lifetime contrast rather than intensity-based staining. Sample courtesy of Rizzoli group, Department of Neuro- and Sensory Physiology, University of Göttingen Medical Center.
FLIM delivers contrast from nanosecond lifetimes rather than intensity, so results are largely independent of probe concentration, excitation power, and moderate photobleaching. Lifetime is sensitive to the local environment, including pH, ions, oxygen, polarity, and quenching, which enables functional readouts that intensity imaging can miss. FLIM also helps separate spectrally similar labels and suppress autofluorescence. The outcome is quantitative, reproducible lifetime maps that work across confocal and two-photon setups and remain robust in complex, heterogeneous samples.
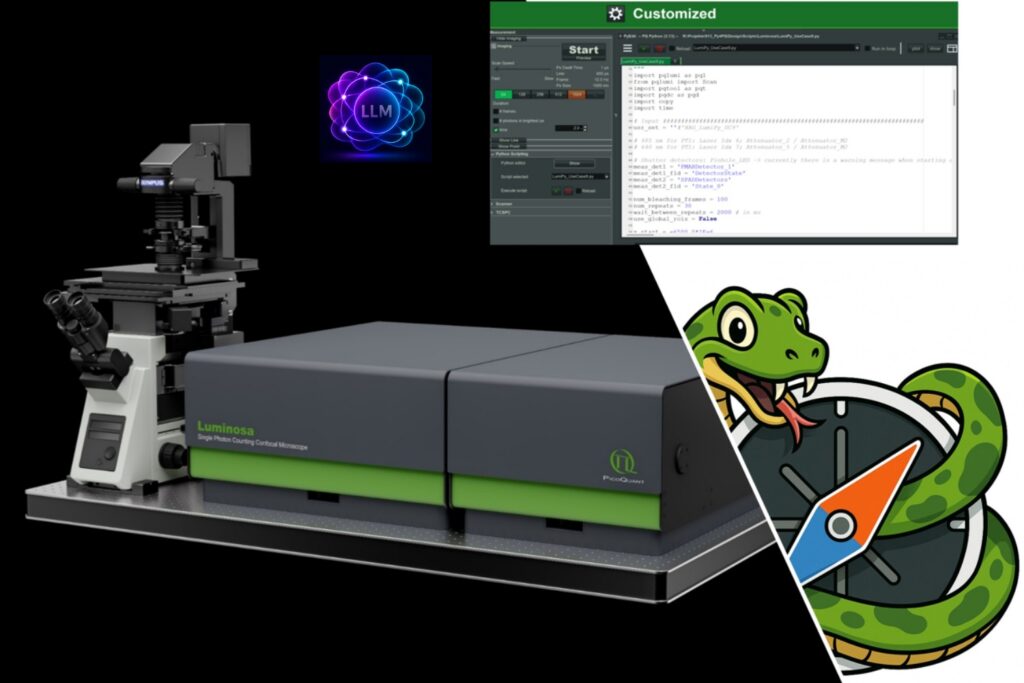
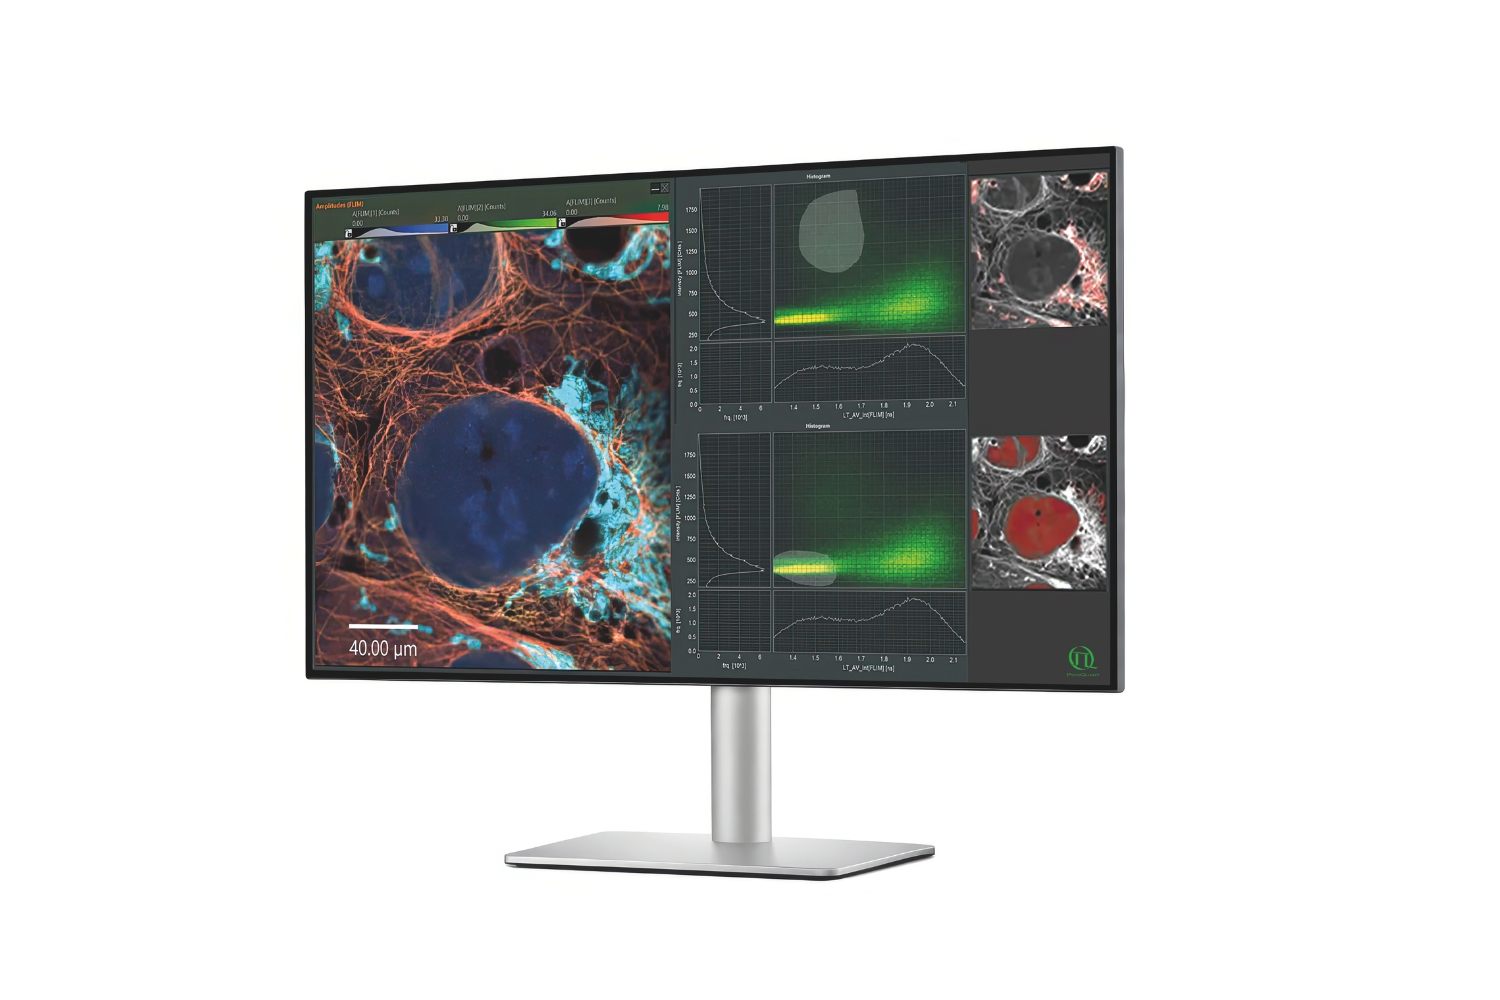
 Luminosa single photon counting confocal fluorescence microscope designed for quantitative time-resolved and single-molecule imaging.
FLIM relies on picosecond pulsed excitation, single-photon–sensitive detection, and timing electronics to measure photon arrival times, typically integrated with a confocal or laser-scanning microscope. Stable synchronization, appropriate optics and filters, and suitable analysis software complete the setup, enabling reliable lifetime mapping across diverse life-science samples.
Integrated systems such as Luminosa combine these components into a single platform, streamlining experimental workflows and ensuring consistent, quantitative fluorescence lifetime measurements. By tightly integrating excitation, detection, timing electronics, and analysis software, such systems reduce setup complexity and improve reproducibility across experiments.
The recorded fluorescence decay data can be processed through several complementary analysis methods, each offering specific advantages for quantification, visualization, or pattern recognition:
 NovaFLIM: Fluorescence Lifetime Imaging Analysis Software
NovaFLIM provides GPU-accelerated, high-speed FLIM analysis with one-click workflows that combine fitting, phasor, and pattern matching. It scales efficiently to large datasets with batch processing and reproducible ROI selection. SymPhoTime 64 streamlines FLIM acquisition and analysis, offering Fast FLIM previews alongside integrated fitting, and pattern-matching workflows in an intuitive interface.
The following examples illustrate how fluorescence lifetime imaging enables label discrimination, functional readouts, and high-speed imaging in biological systems. They highlight both quantitative lifetime analysis and dynamic FLIM approaches in real-world experiments.
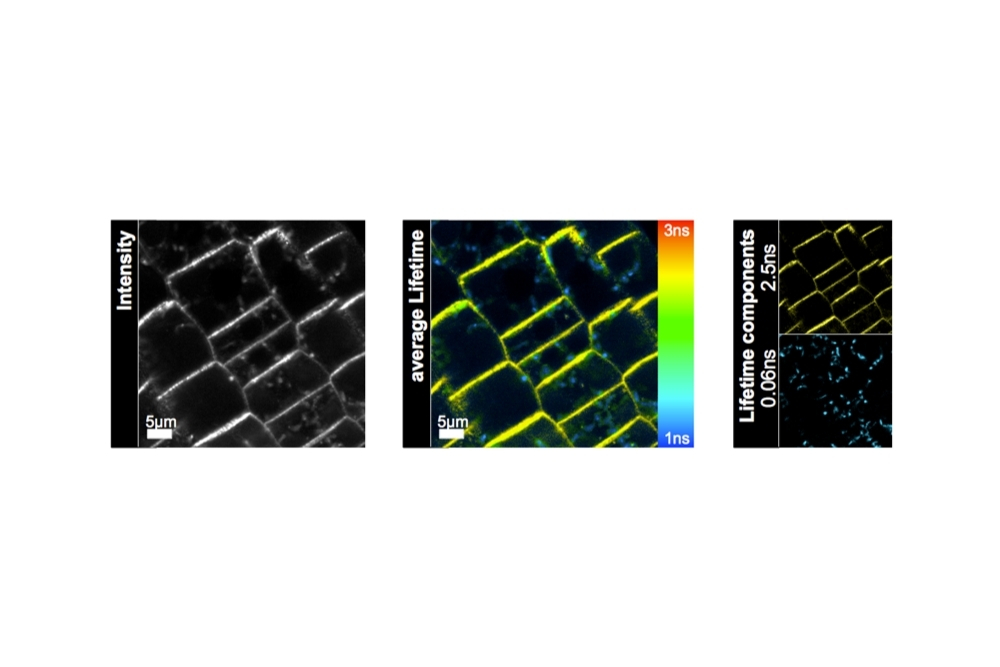
FLIM enables discrimination between spectrally overlapping fluorophores by incorporating lifetime contrast. In Arabidopsis root cells expressing GFP-tagged PIN2, lifetime analysis separates GFP fluorescence from intrinsic autofluorescence. Measurements were performed on a MicroTime 200 system, demonstrating robust label separation through multi-component lifetime fitting.
RapidFLIMHiRes enables fast lifetime imaging of highly mobile giant unilamellar vesicles (GUVs). In this example, NBD- and rhodamine-labeled lipids were incorporated into non-phase-separated GUVs, and lifetime changes due to FRET were recorded at 5.6 frames per second, allowing precise tracking of dynamic membrane behavior.
RapidFLIMHiRes enables dynamic recording of dye-labeled bead diffusion based on lifetime contrast. Nile Red (3.3 ns, 3.42 µm beads) and Dragon Green (4.0 ns, 2.07 µm beads) were distinguished by a 700 ps lifetime difference. Measurements were performed using an LSM Upgrade Kit on an Olympus FluoView FV1000 microscope.
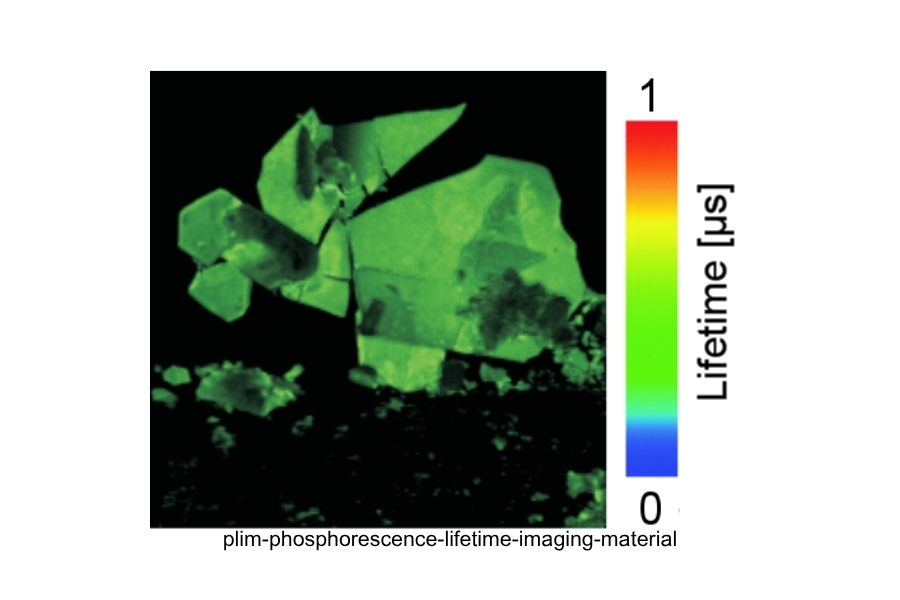
A time-resolved imaging technique based on phosphorescence lifetimes, which are considerably longer (micro- to millisecond range) than fluorescence lifetimes, making it highly sensitive to oxygen concentration and related microenvironmental parameters.
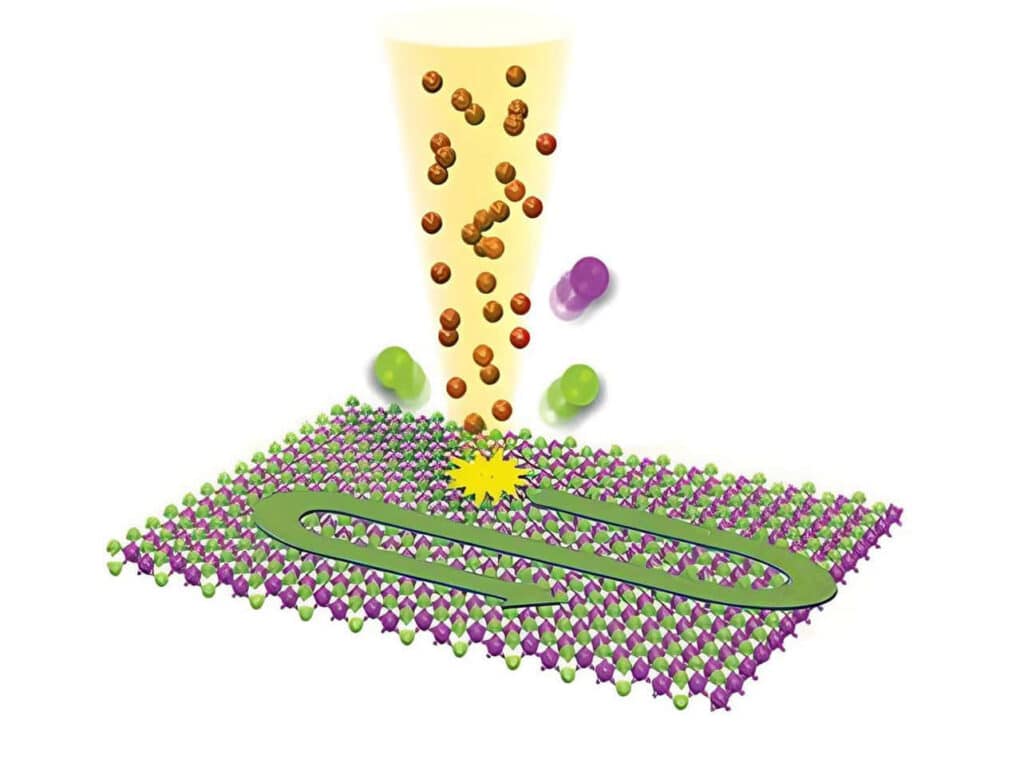
A time-resolved spectroscopy method for semiconductors and nanomaterials that measures luminescence decay to quantify carrier and exciton lifetimes, nonradiative recombination, and defect states. A sister technique to FLIM for materials science, extending lifetime analysis beyond imaging to wafer, thin-film, and quantum-dot studies.