Photon Counting Detectors
High-performance SPAD, PMT and hybrid detectors for reliable photon counting across materials science, life science, quantum optics, and metrology.
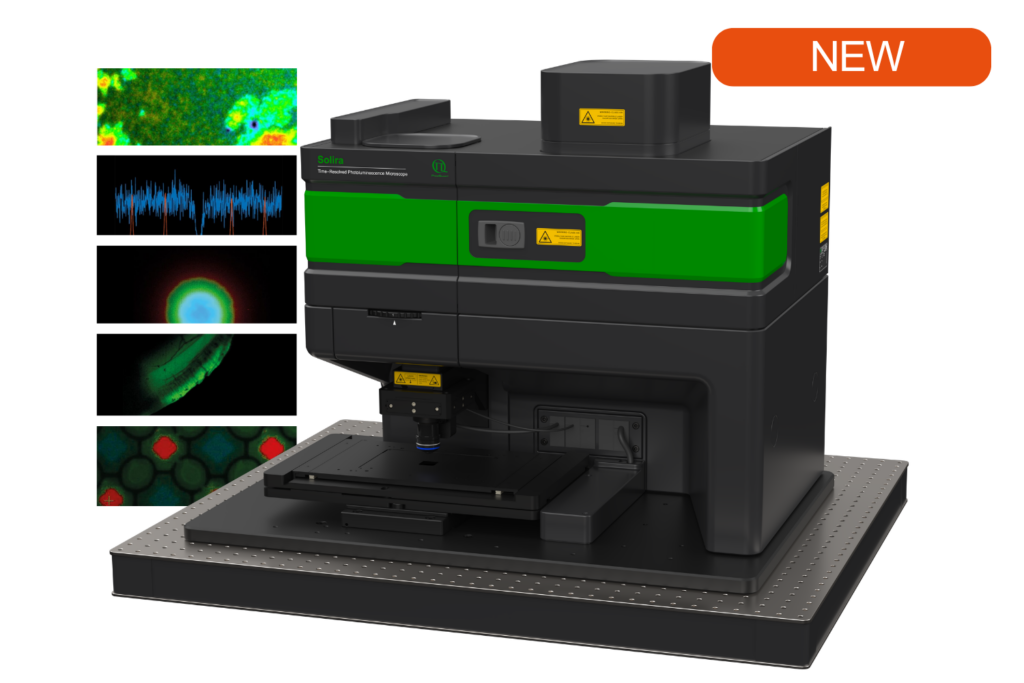
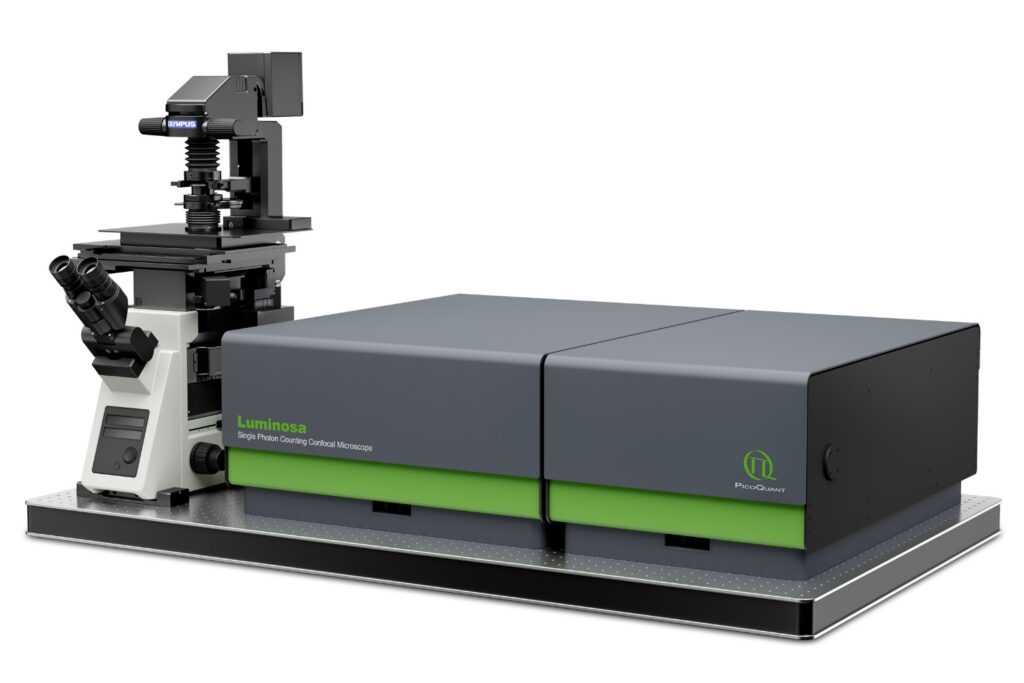
Simplify your materials characterization with one flexible TRPL microscope enabling multiple methods for precise and efficient analysis.
Complete confocal fluorescence microscope that empowers researchers to advance quantitative functional imaging from individual molecules to cells and tissues.
Compact FLIM and FCS upgrade kit that adds advanced functional imaging and correlation analysis to existing laser scanning microscopes.

Designed for flexible, sensitive, and precise steady-state and time-resolved spectroscopy across the UV to NIR range and time scales from picoseconds to milliseconds.
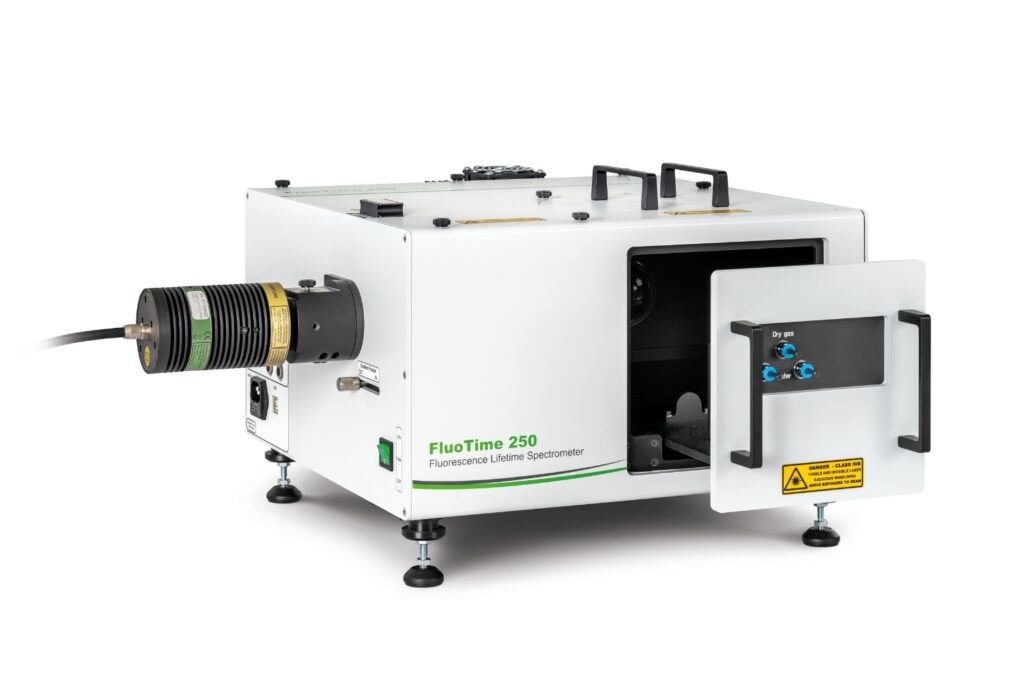
Modular lifetime spectrometer designed for flexible fluorescence and photoluminescence measurements in both materials and life science research.
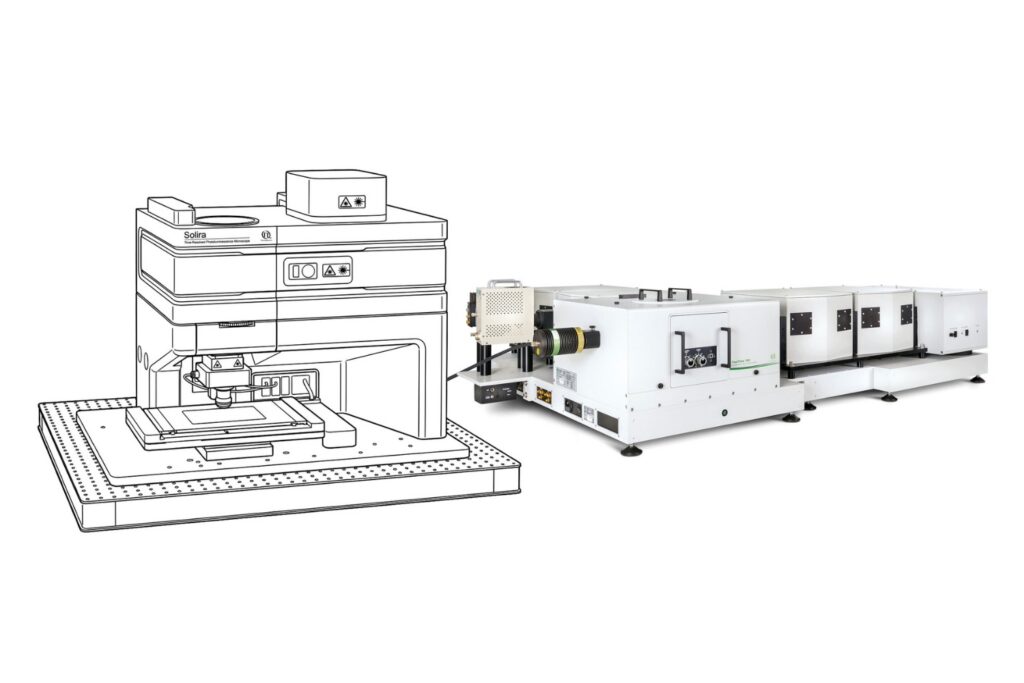
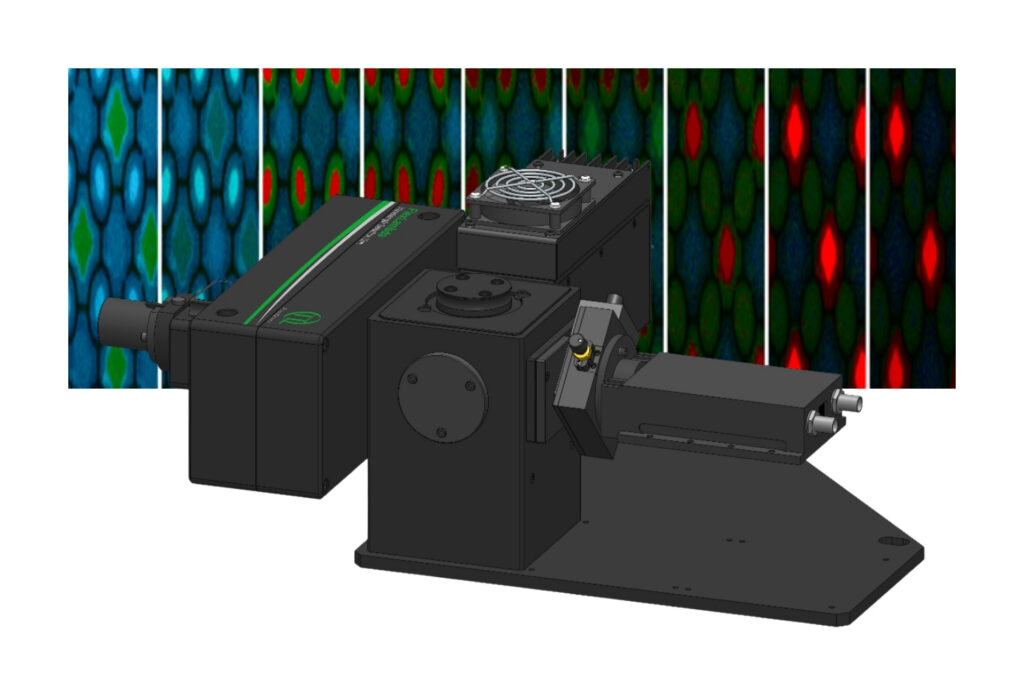
Add spectral and time-resolved photoluminescence to your setup through flexible microscope–spectrometer coupling options.
Get the most out of superconducting nanowire detectors in large-scale quantum communication and computing experiments requiring precise multichannel timing.
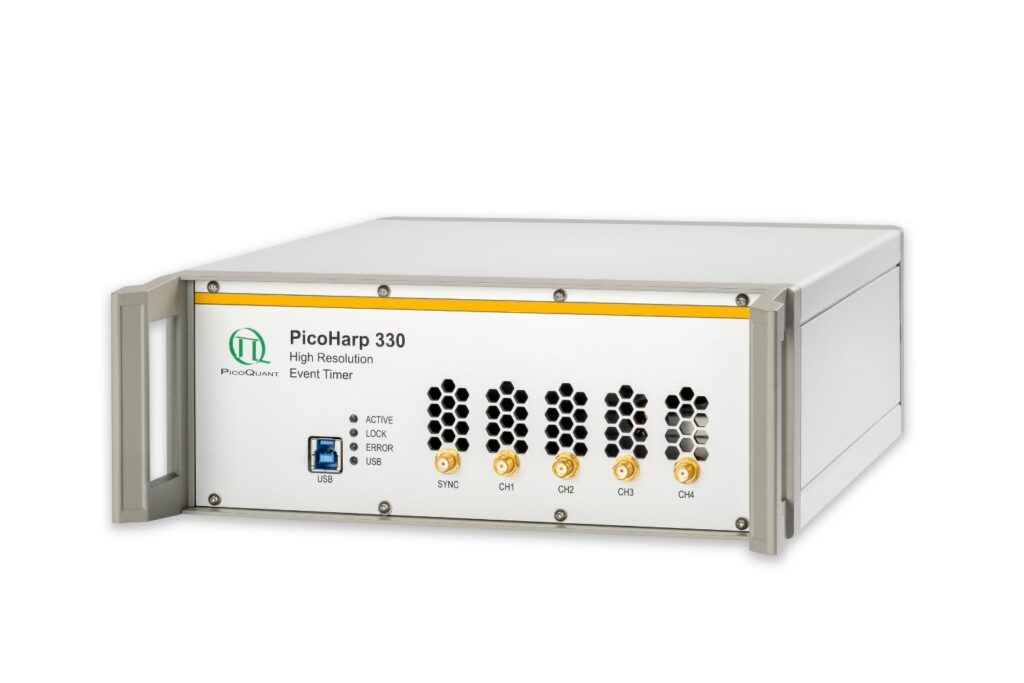
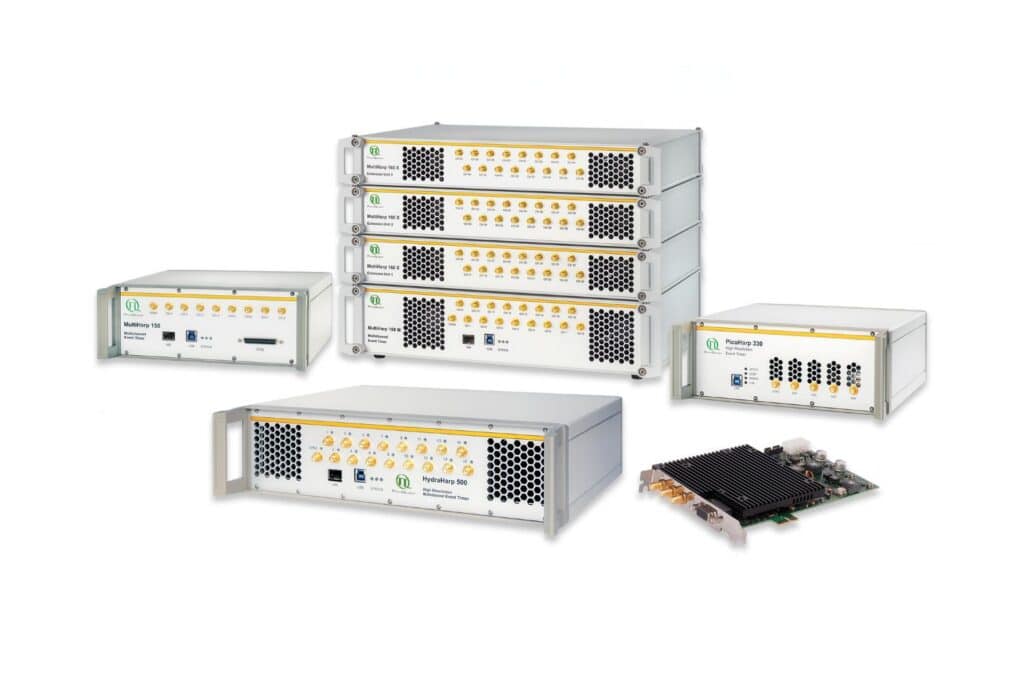
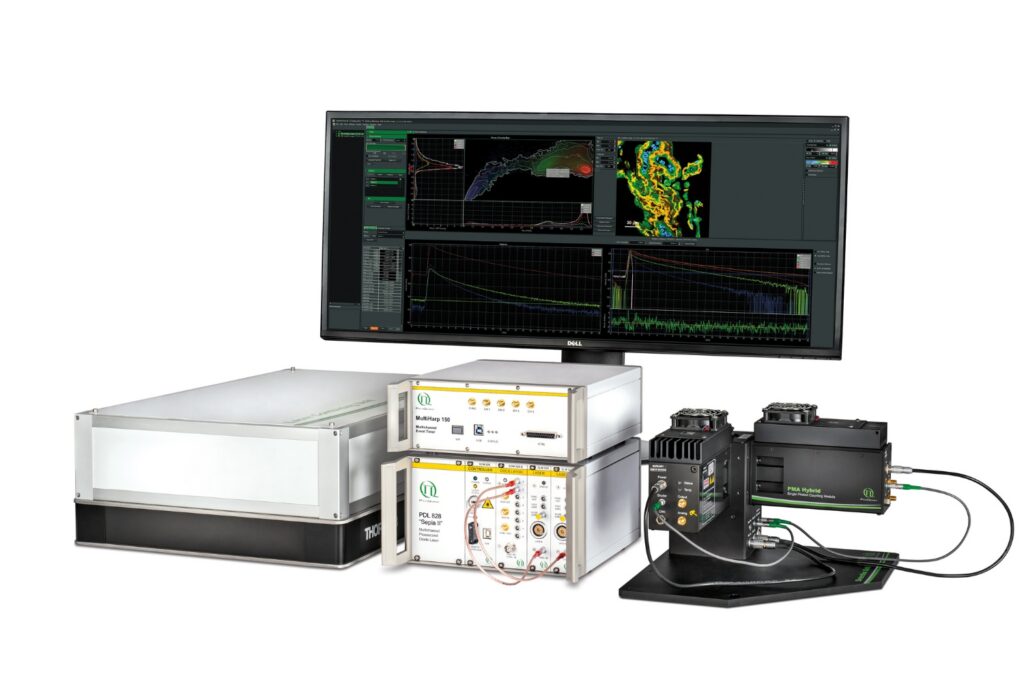
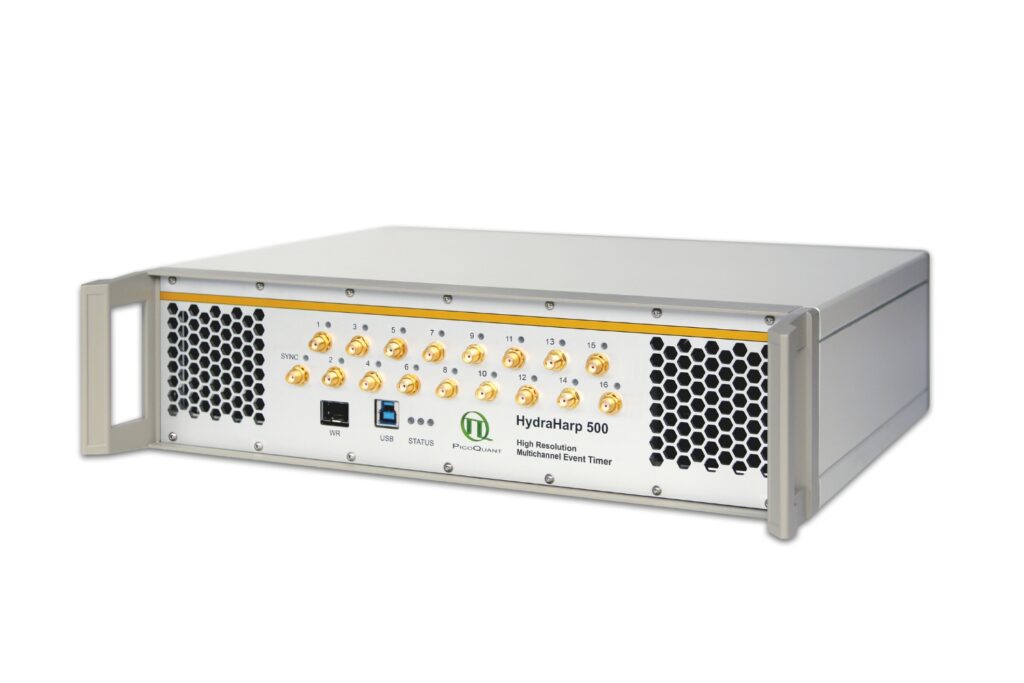
Boost your time-resolved experiments with a flexible, high-precision time tagging and TCSPC unit for materials science and quantum sensing.
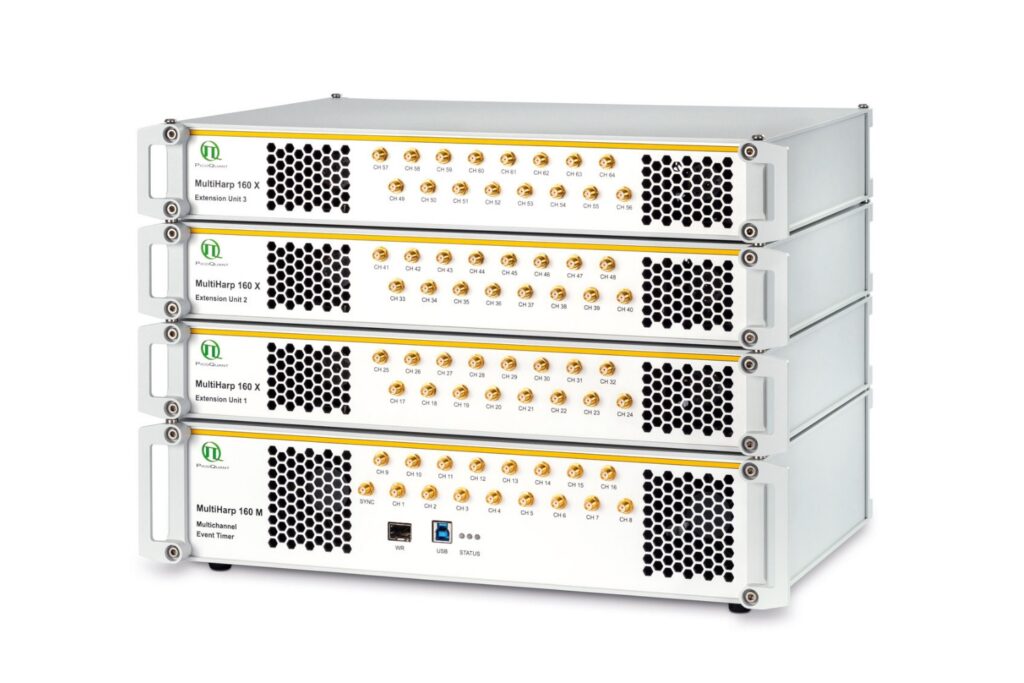
Scale your photonic quantum computing and detector characterization setups while maintaining performance, flexibility, and high data throughput.
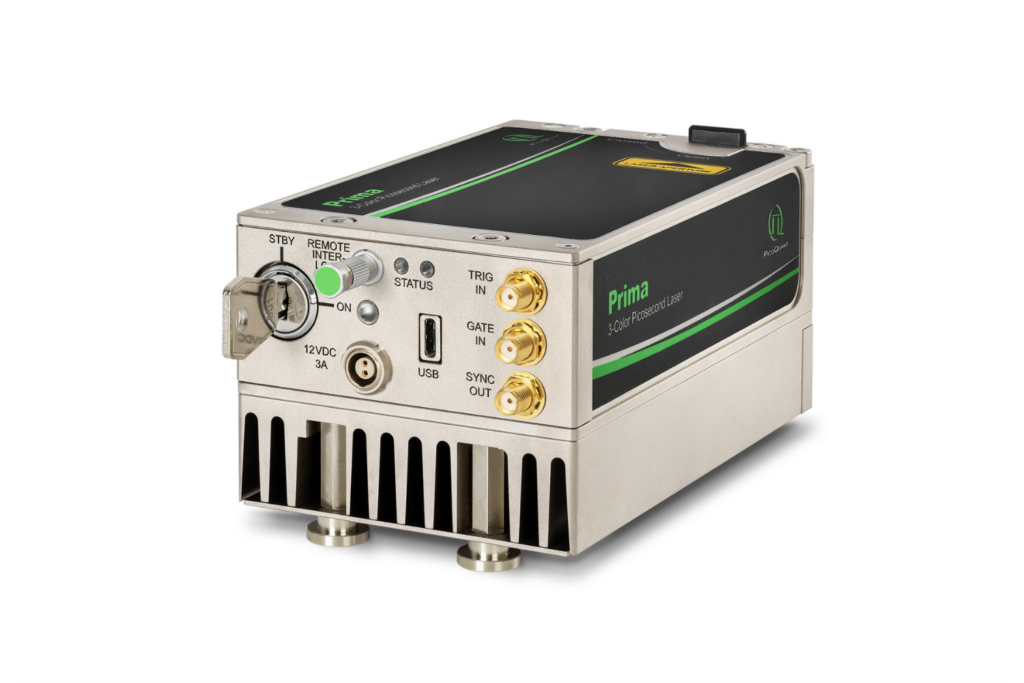
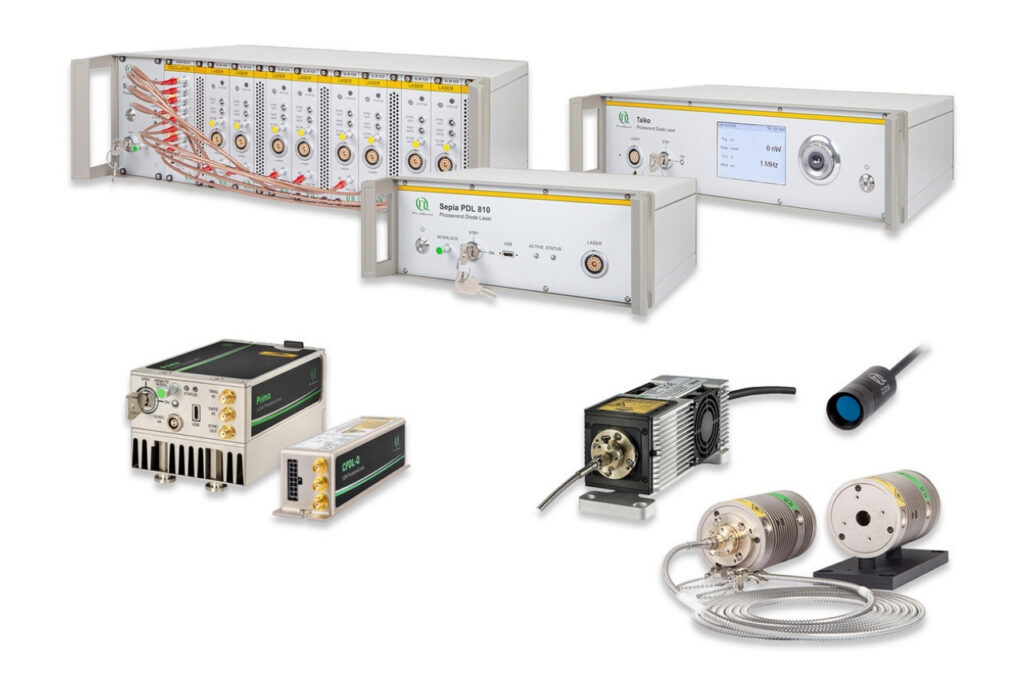
Compact 3-color picosecond laser delivering flexible ns to ms excitation with cost-effective multicolor performance and straightforward operation.
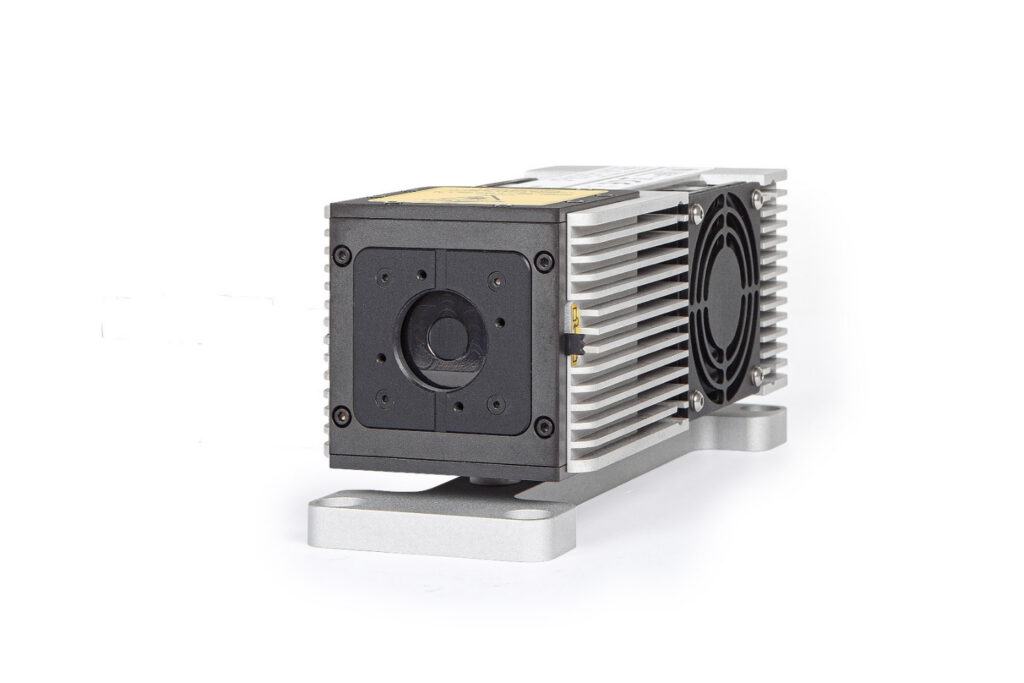
Smart picosecond laser diode heads covering UV-A to NIR, providing the right combination of power, pulse width, and diode type for any time-resolved technique.
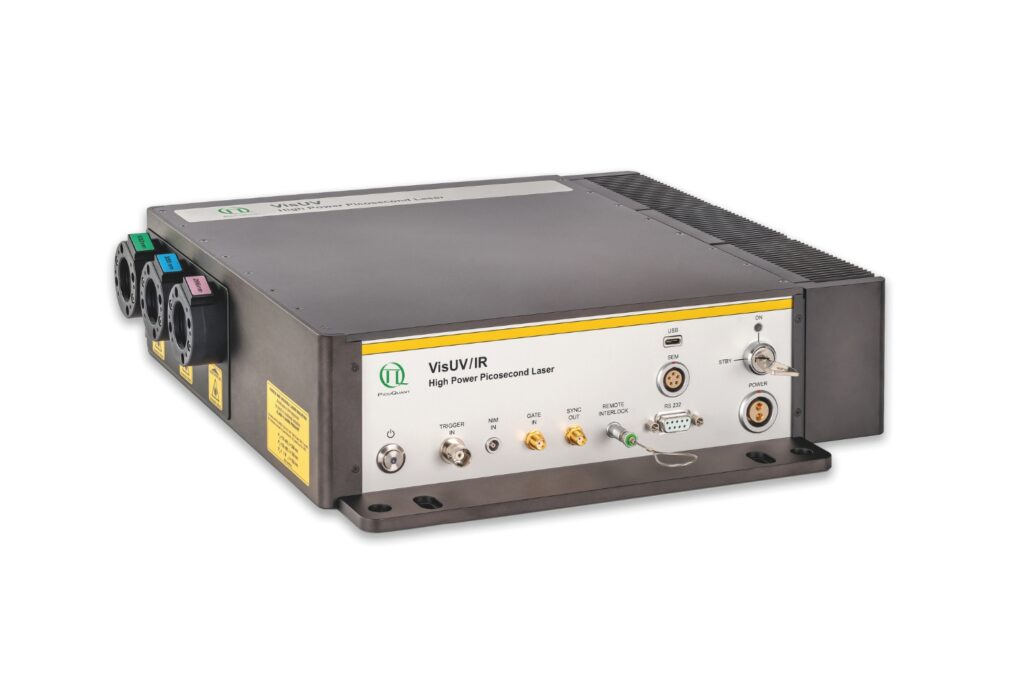
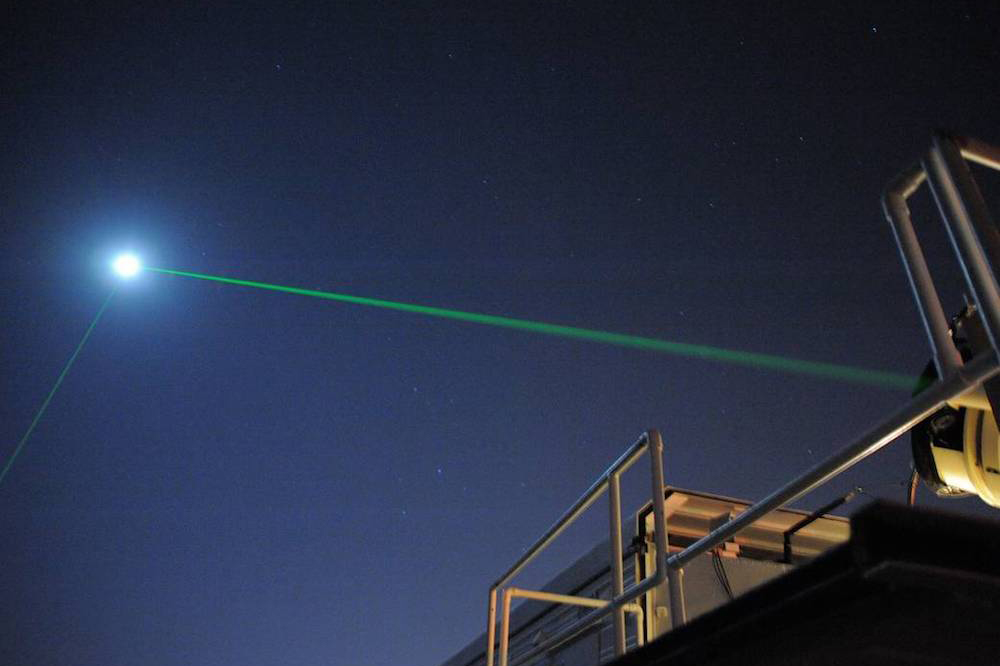
VisUV provides clean short pulses and stable timing across key UV and visible wavelengths, including deep UV lines as well as 488 nm and 532 nm.
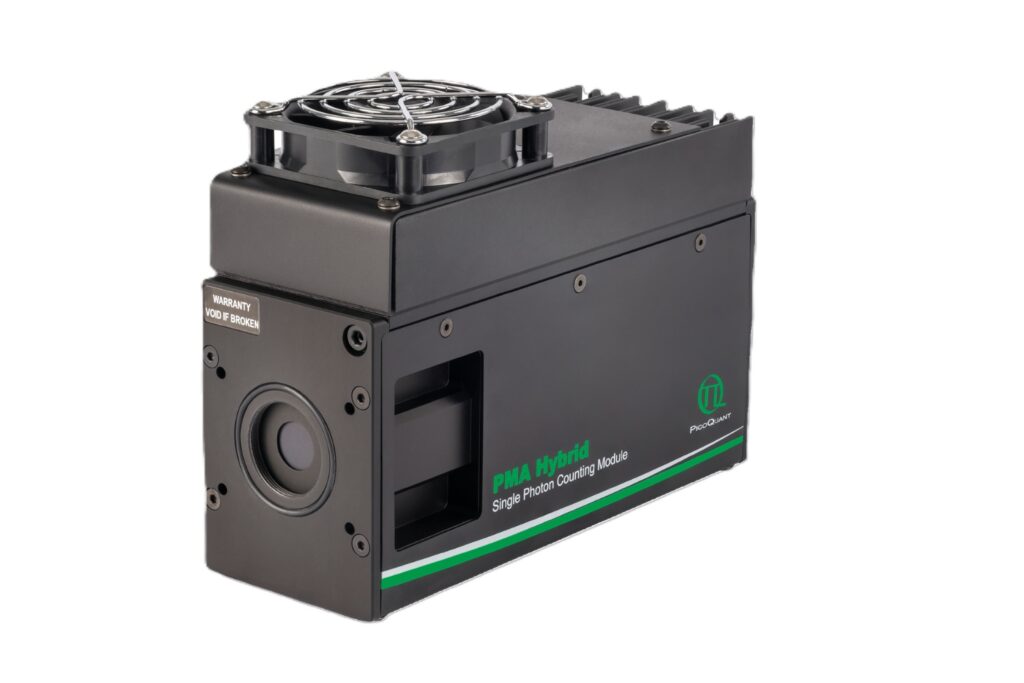
Enhance your single-photon counting experiments with wide dynamic range and excellent timing precision in the UV and visible even at the highest count rates.
Capture even the weakest signals over large areas with maximum dynamic range and enhanced low-light sensitivity in a compact detector design.
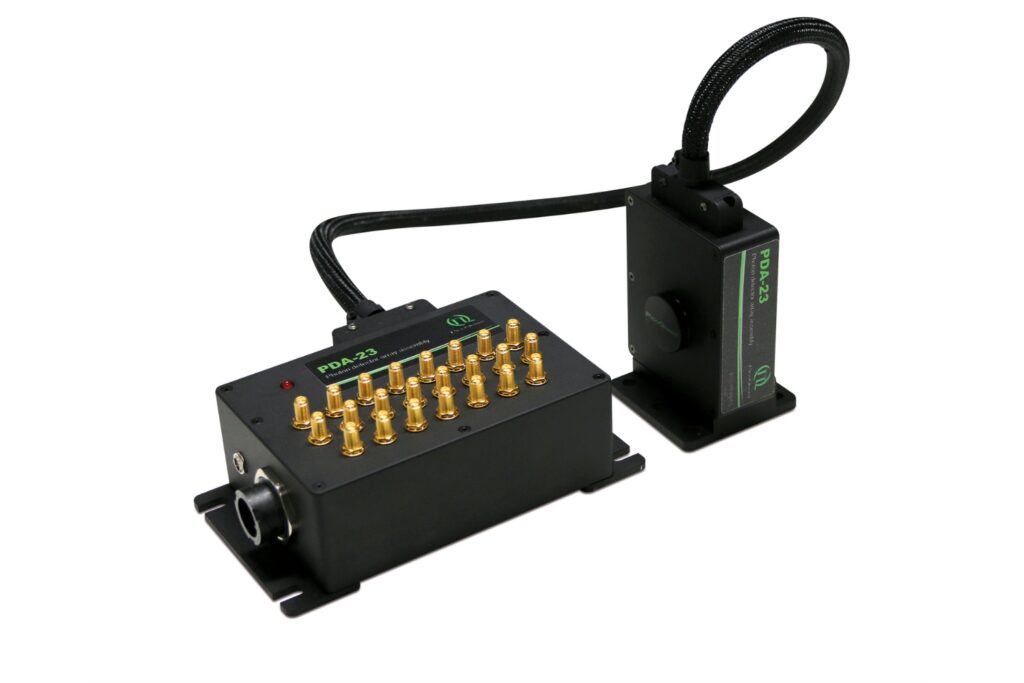
Unlock spatially resolved single-photon detection with a 23-pixel SPAD array, combining low dark counts and precise time tagging for advanced experiments.
Advanced FLIM analysis software for fast, accurate interpretation of lifetime imaging data.
Intuitive, free software solution for real-time, high-precision photon data acquisition, visualization, and initial data analysis.
Advanced software for time-resolved fluorescence acquisition and analysis.
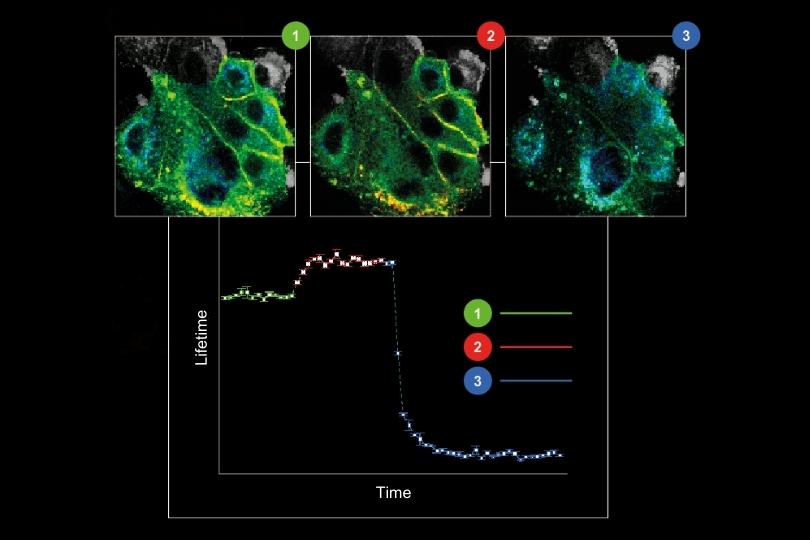
An imaging technique that uses fluorescence lifetimes to generate image contrast.
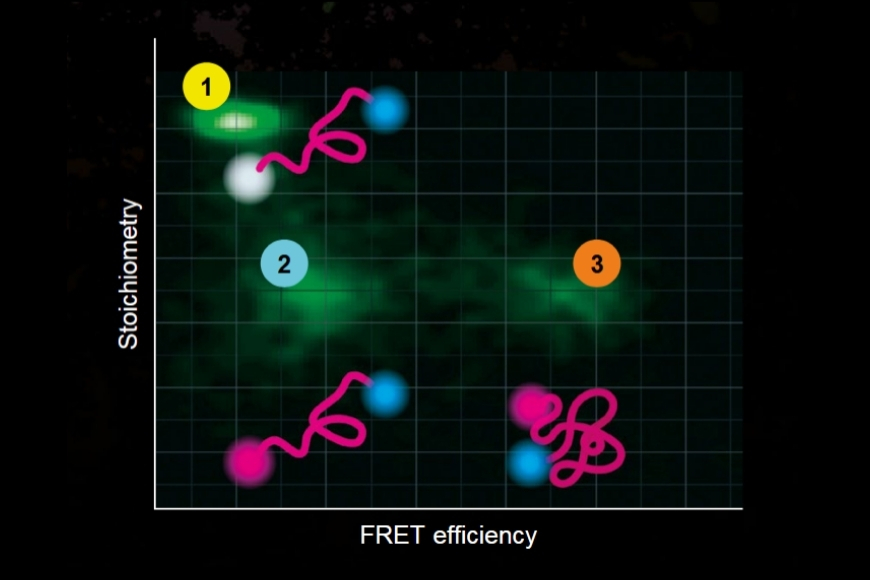
Investigating how proteins dynamically explore multiple conformational states that control biological function.
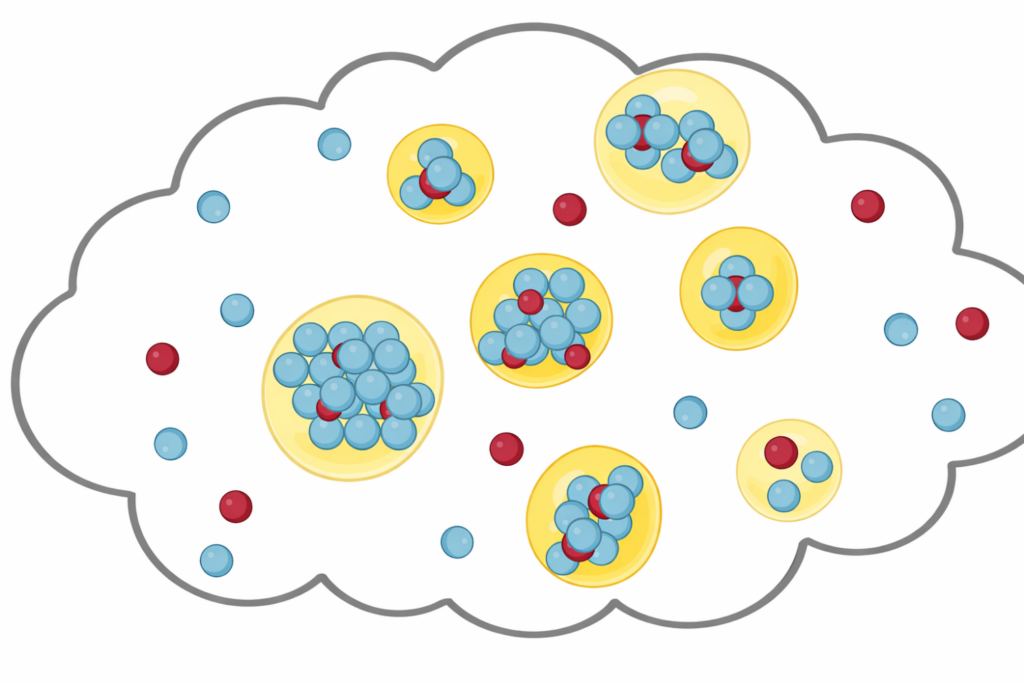
Investigating how biomolecules separate into dynamic liquid phases to organize cellular space and regulate biological function.
A time-resolved technique that measures photoluminescence lifetimes to reveal excited-state dynamics in materials.
Studying exciton dynamics, charge carrier processes, and structural properties through optical and time-resolved characterization methods.

Investigating charge-carrier lifetimes and recombination dynamics to enable precise optical characterization of material quality and device performance.
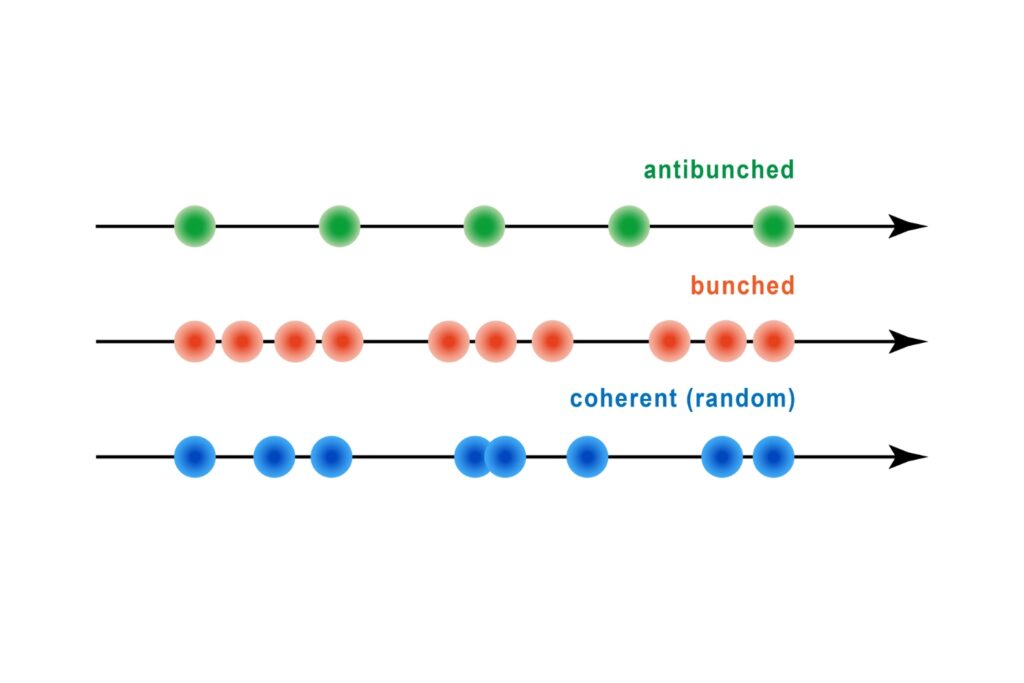
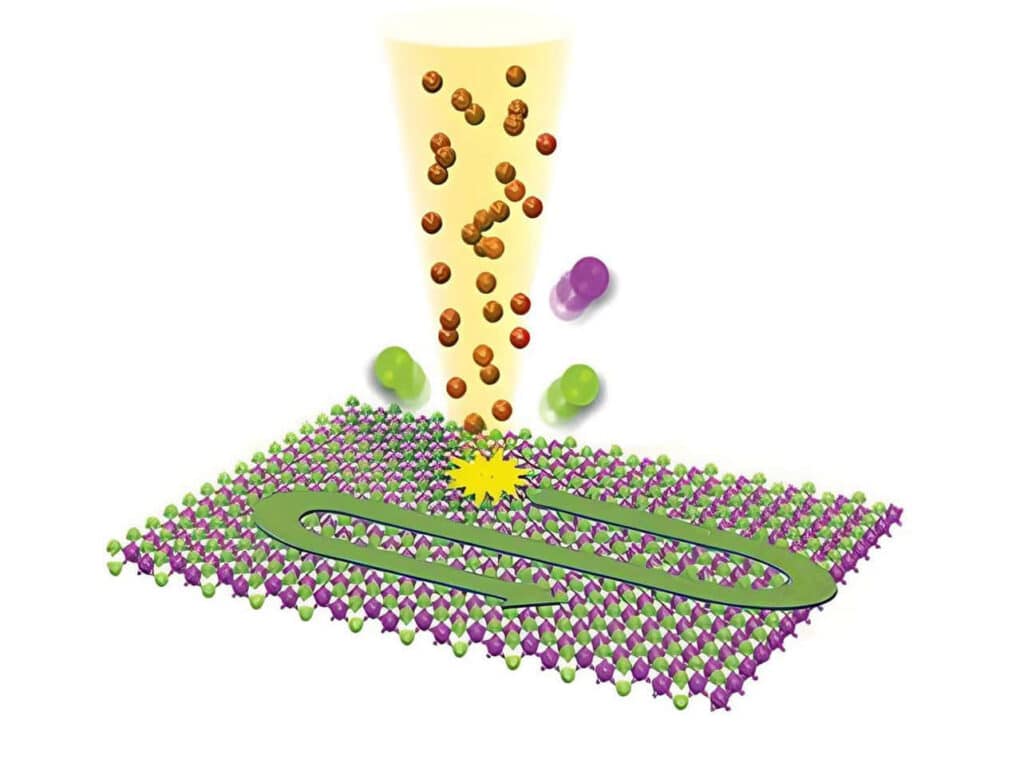
A quantum optical signature revealed by time-resolved photon correlation analysis to identify single-photon emission in materials and nanostructures.
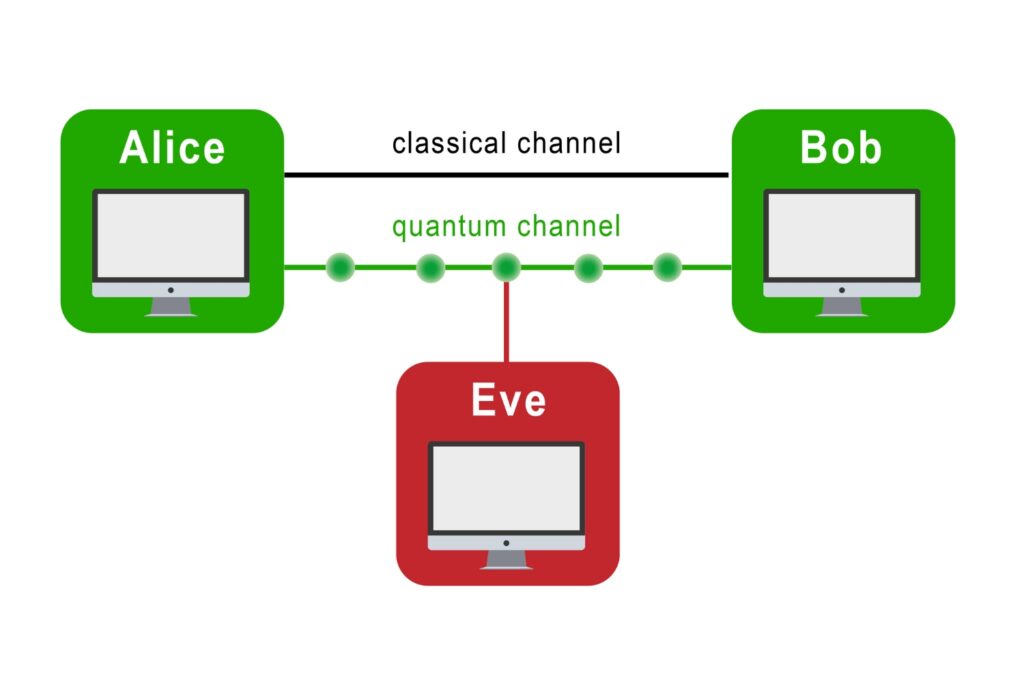
The transmission of information using individual photons, using quantum effects to ensure absolute security.
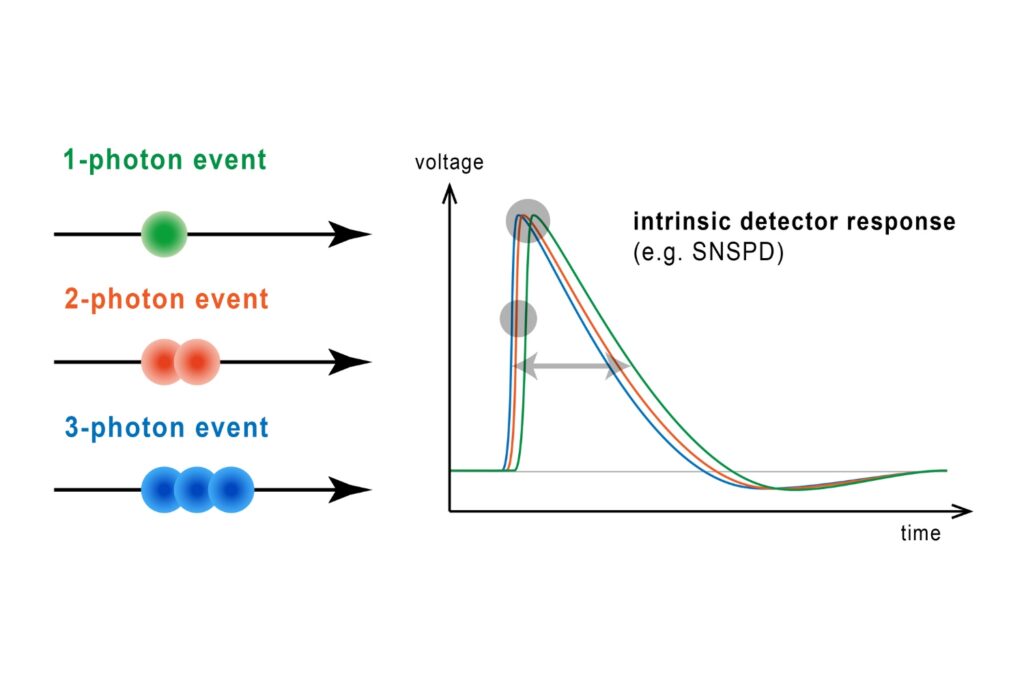
Quantifying photons per detection event enables direct access to photon-number statistics, providing insight into quantum and statistical properties of light.
An optical technique that analyzes light emission under electrical excitation to reveal electronic properties of electroluminescent materials.
Monitoring environmental signals and trace compounds to understand dynamic changes in natural and engineered environments.
A photon timing technique that measures single-photon arrival times to resolve ultrafast dynamics in fluorescence, materials research, and quantum optics.
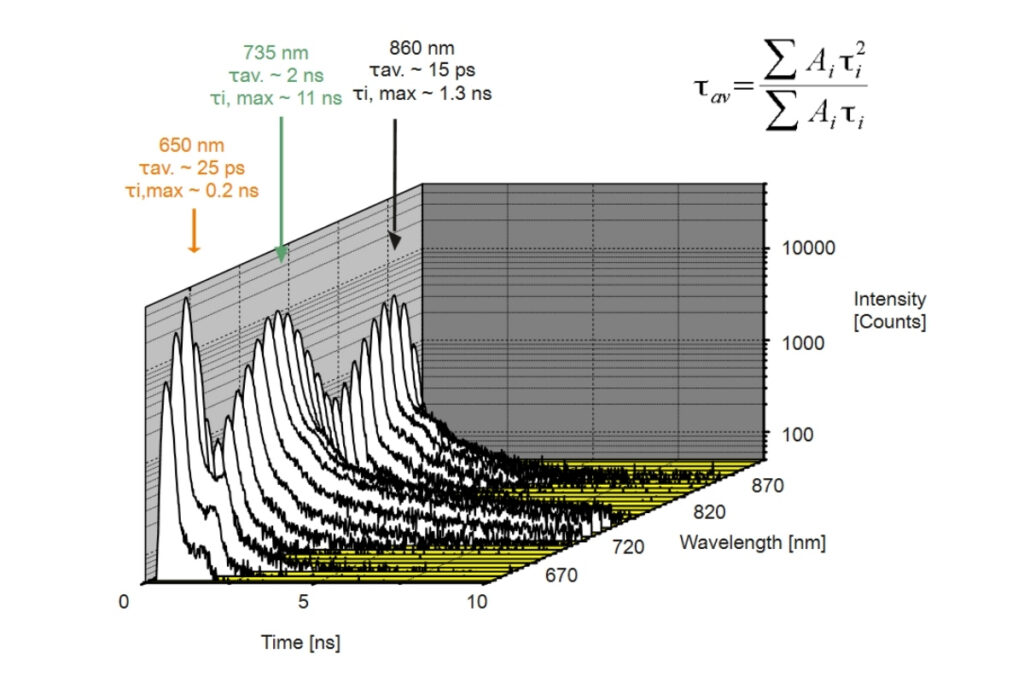
Time-resolved photoluminescence (TRPL) is a spectroscopy technique that measures how the photoluminescence of a material decays over time after pulsed excitation. By tracking the emission dynamics from a few picoseconds to several microseconds, TRPL reveals how quickly excited states relax and provides insight into recombination mechanisms and material quality. Unlike steady-state photoluminescence, which captures only spectral intensity, TRPL records the temporal evolution of light emission and is therefore a key method for studying dynamic processes in advanced optical and electronic materials.
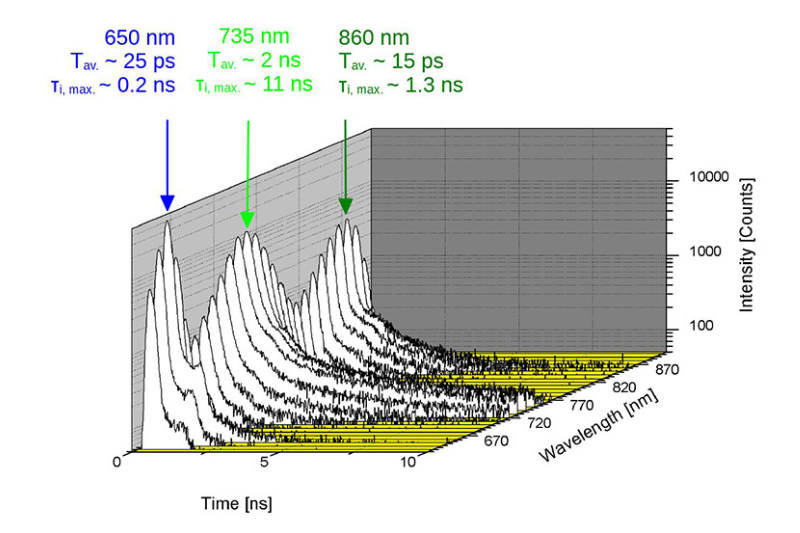
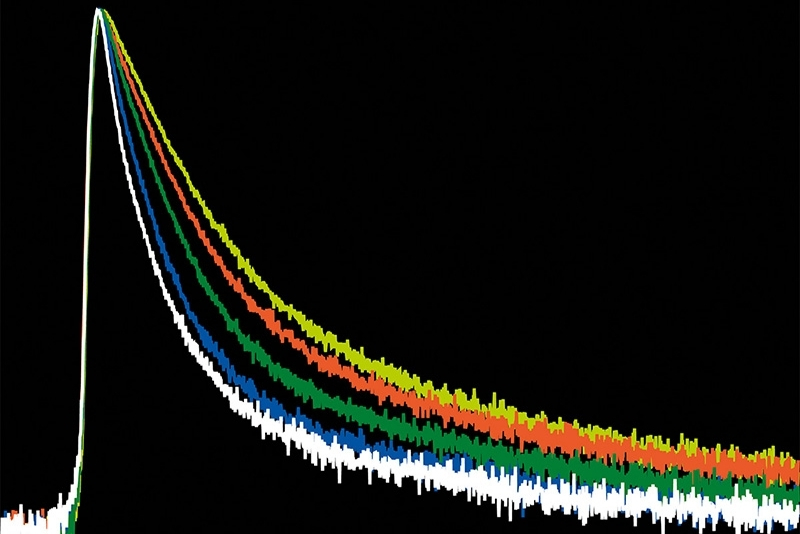
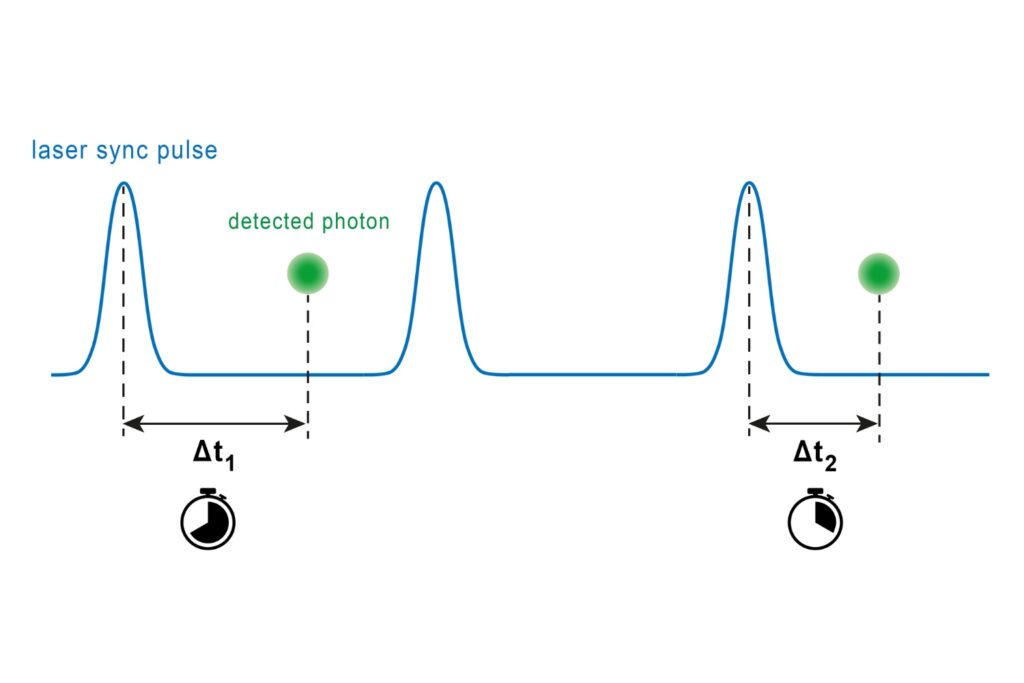
In TRPL measurements, the Time-Correlated Single Photon Counting (TCSPC) method is commonly used to determine photoluminescence lifetimes with high precision. The sample is excited by ultrafast, periodic laser pulses, and the arrival time of each emitted photon is measured relative to the excitation pulse. Repeating this process produces a histogram of photon arrival times that represents the photoluminescence decay curve. The shape of this curve, often described by monoexponential or multiexponential behavior, reveals the recombination dynamics of excited states. By fitting the decay, researchers can extract lifetimes that typically range from picoseconds to microseconds.
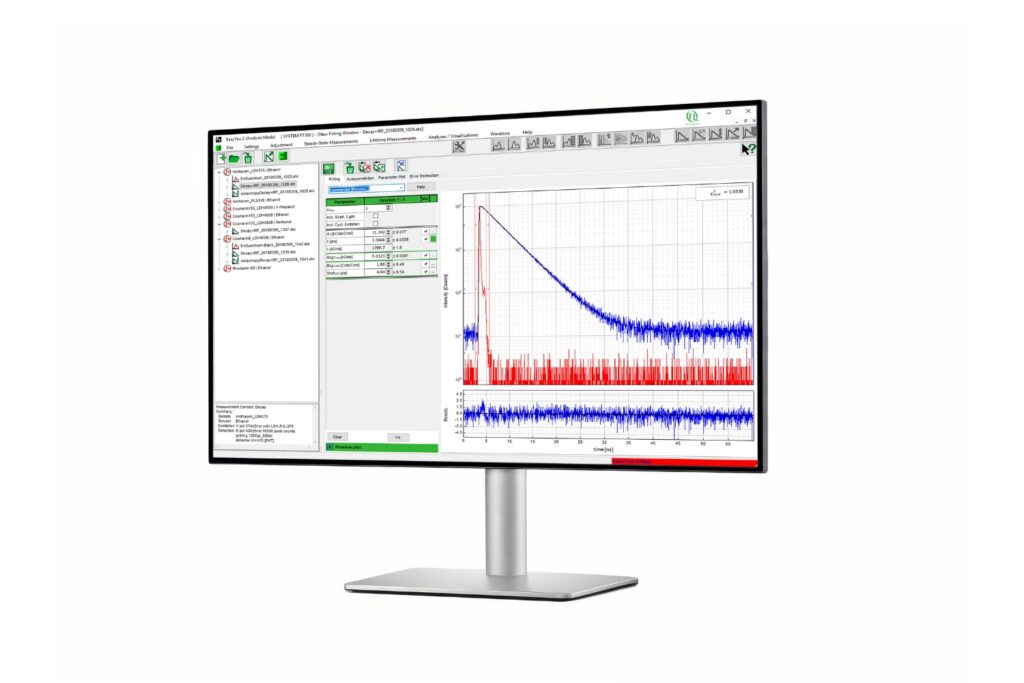
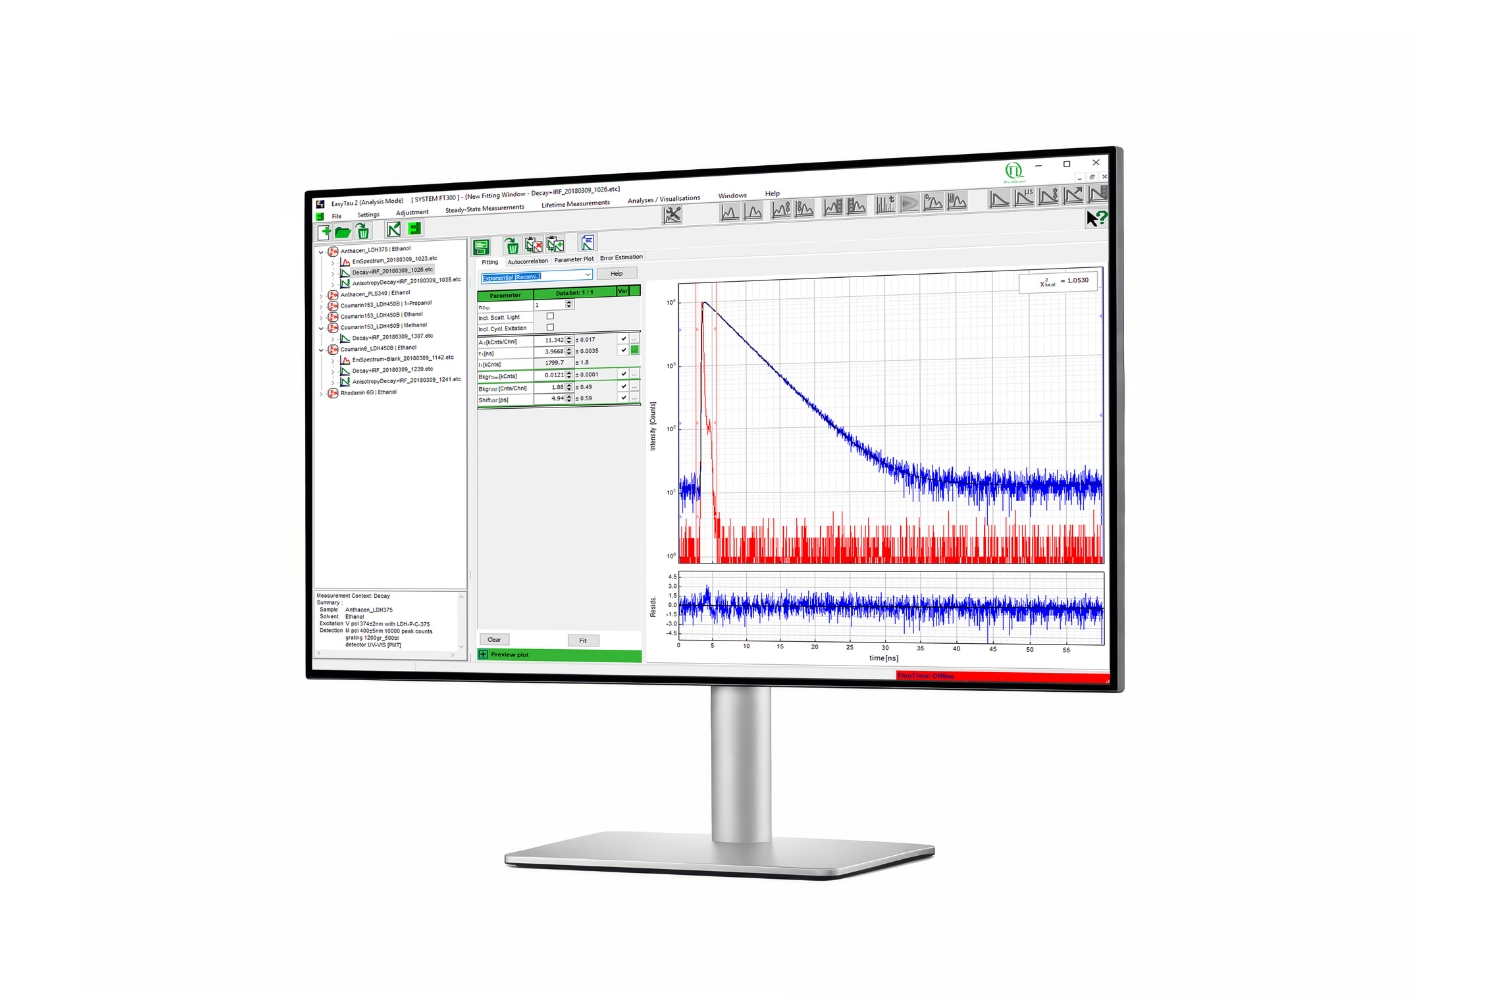 EasyTau 2: spectroscopy control and analysis software
Time-resolved photoluminescence (TRPL) provides access to dynamic photophysical processes that cannot be resolved by steady-state techniques. It offers a detailed view of how materials respond after photoexcitation.
With its broad temporal range from picoseconds to milliseconds, TRPL serves as a powerful method for investigating both ultrafast dynamics and long-lived states in solar cells, semiconductors, nanomaterials, and other advanced optoelectronic materials.
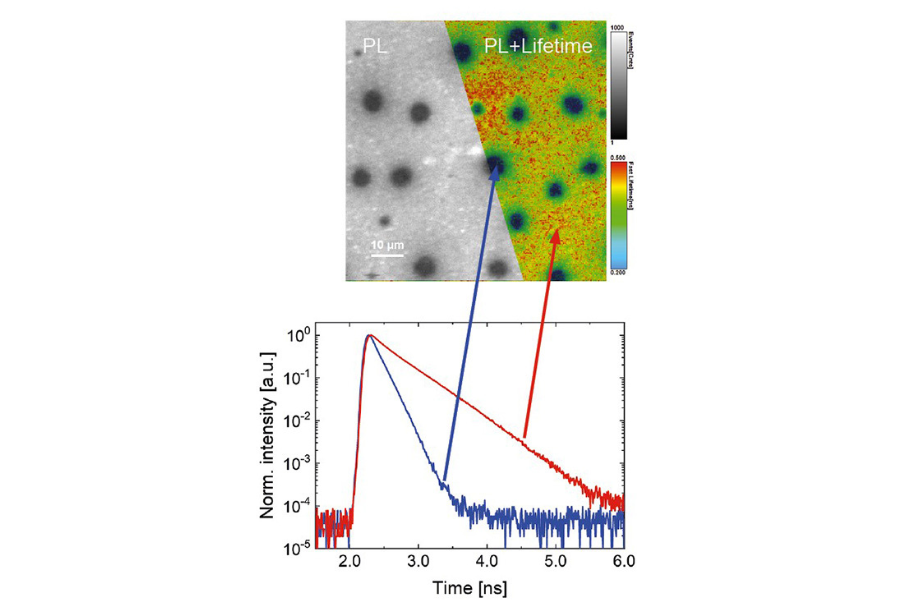 Top: TRPL image of a CIGS solar cell acquired with SNSPD detector, bottom: Normalized photoluminescence decay curve in bulk material (red) and at a defect site (blue).
Time-resolved photoluminescence (TRPL) is a key technique for understanding the fundamental optoelectronic properties of materials. It reveals how excited states evolve in time, providing direct insight into carrier recombination pathways, defect-related losses, and energy transfer mechanisms. Unlike steady-state photoluminescence, which measures only emission intensity, TRPL links temporal behavior to material quality and device performance. This makes it indispensable for optimizing semiconductors, nanomaterials, and hybrid systems used in light-emitting diodes, lasers, and photovoltaic devices. By quantifying carrier lifetimes and identifying limiting processes, TRPL supports the development of more efficient, stable, and tunable optoelectronic materials.
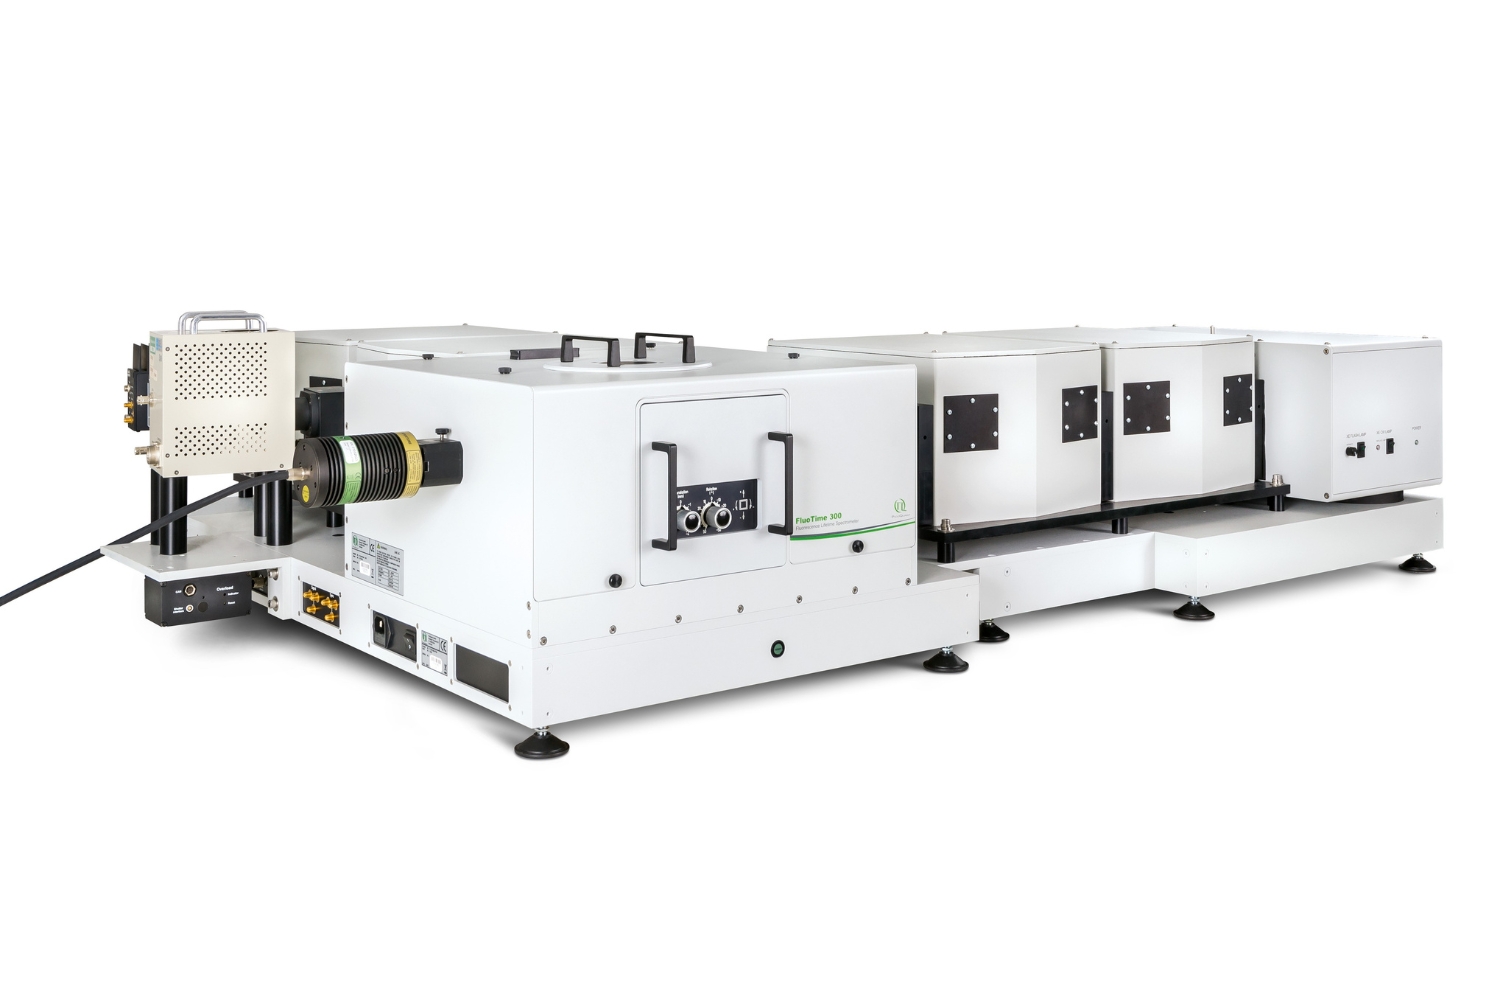 FluoTime 300 - high-end photoluminescence spectrometer.
TRPL requires a pulsed excitation source with a well-defined repetition rate, typically provided by picosecond or femtosecond lasers. The emitted photons are detected using single-photon–sensitive detectors such as photomultiplier tubes or avalanche photodiodes, combined with precise timing electronics for Time-Correlated Single Photon Counting (TCSPC). Accurate synchronization between excitation and detection, along with appropriate optics, filters, and dispersion control, ensures reliable lifetime measurements. Dedicated software is used to construct decay curves and extract lifetimes, enabling detailed analysis of carrier dynamics in semiconductors and nanomaterials.
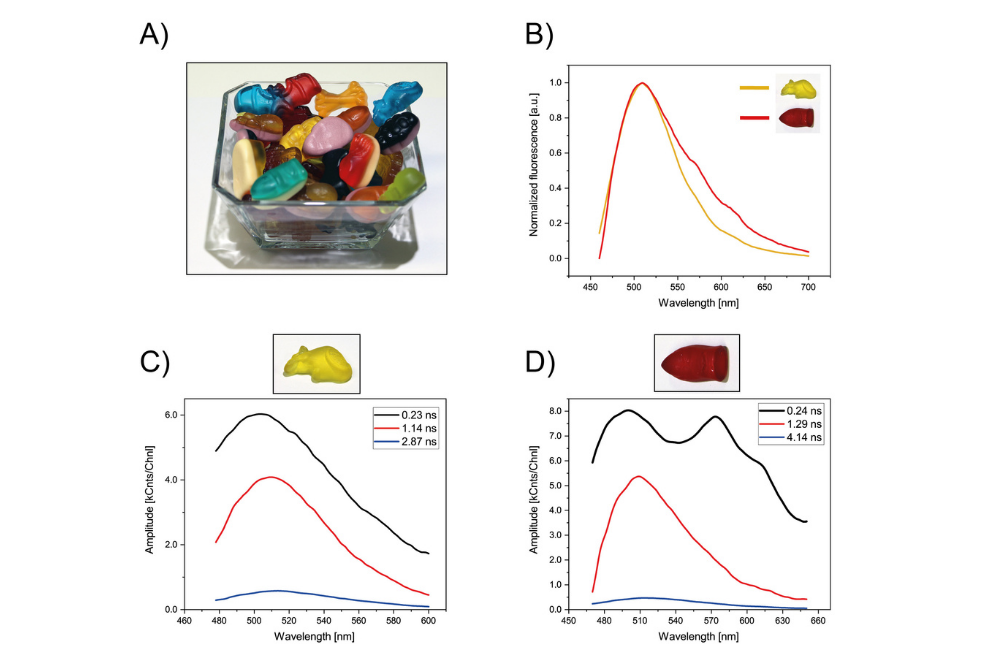
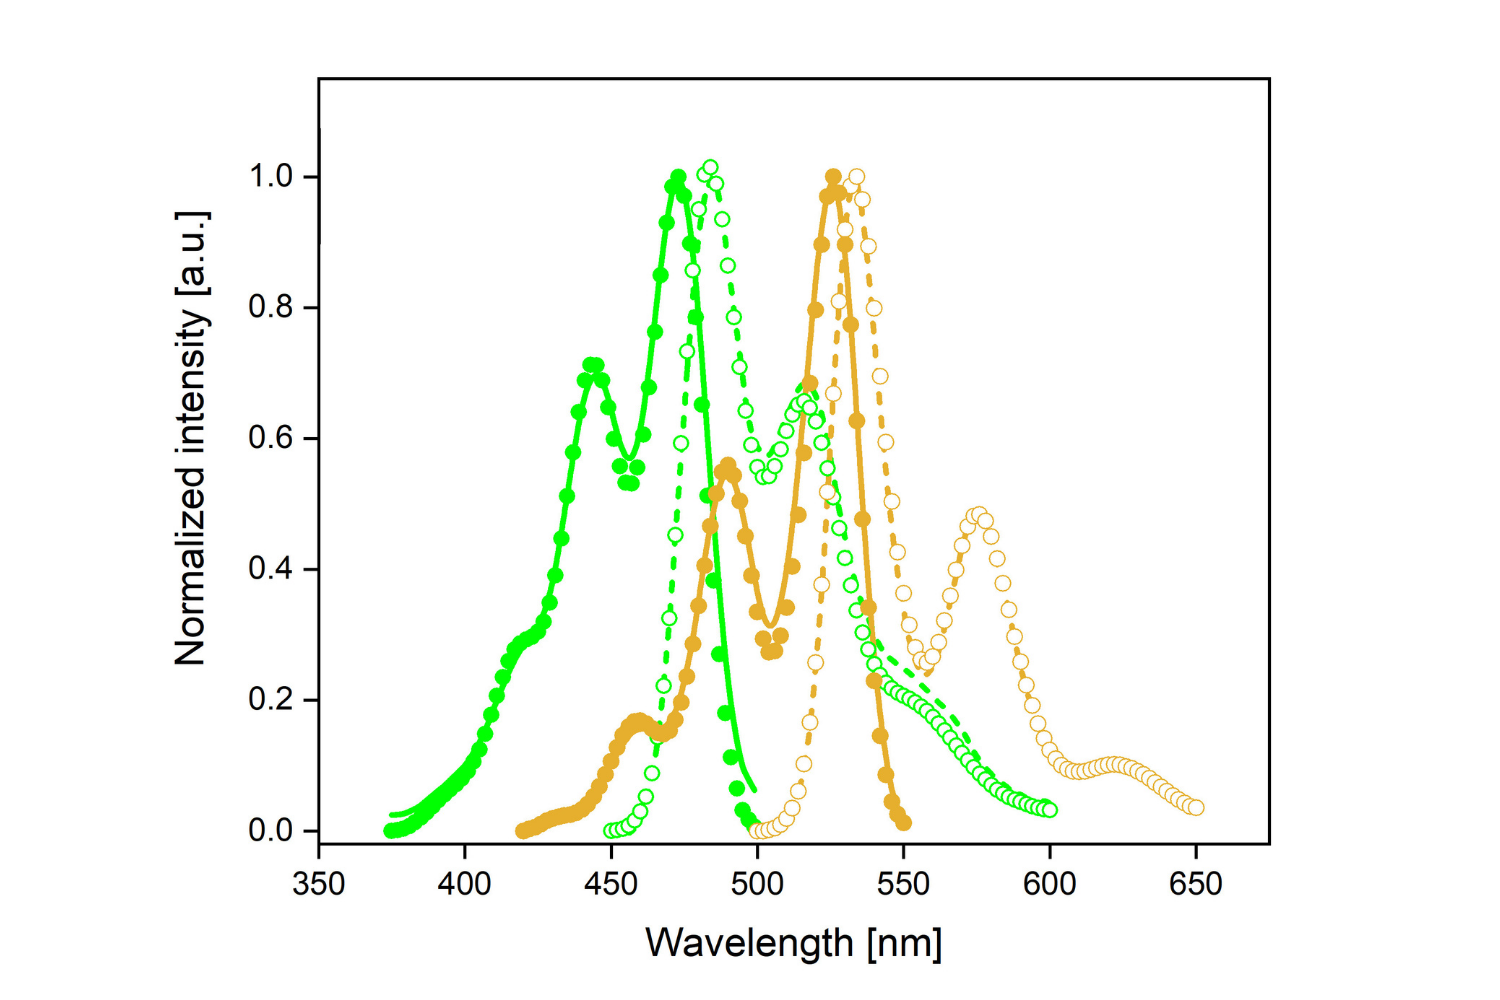
Time-resolved photoluminescence was applied to gummy bears, CIGS solar cells, and LED display pixels to compare lifetime behavior across diverse materials. While confectionery samples illustrate spectral and lifetime differences, solar cells and LEDs reveal spatial variations in emission dynamics and material quality. Measurements were performed using the FluoTime 300 spectrometer combined with the upright widefield microscope FluoMic.
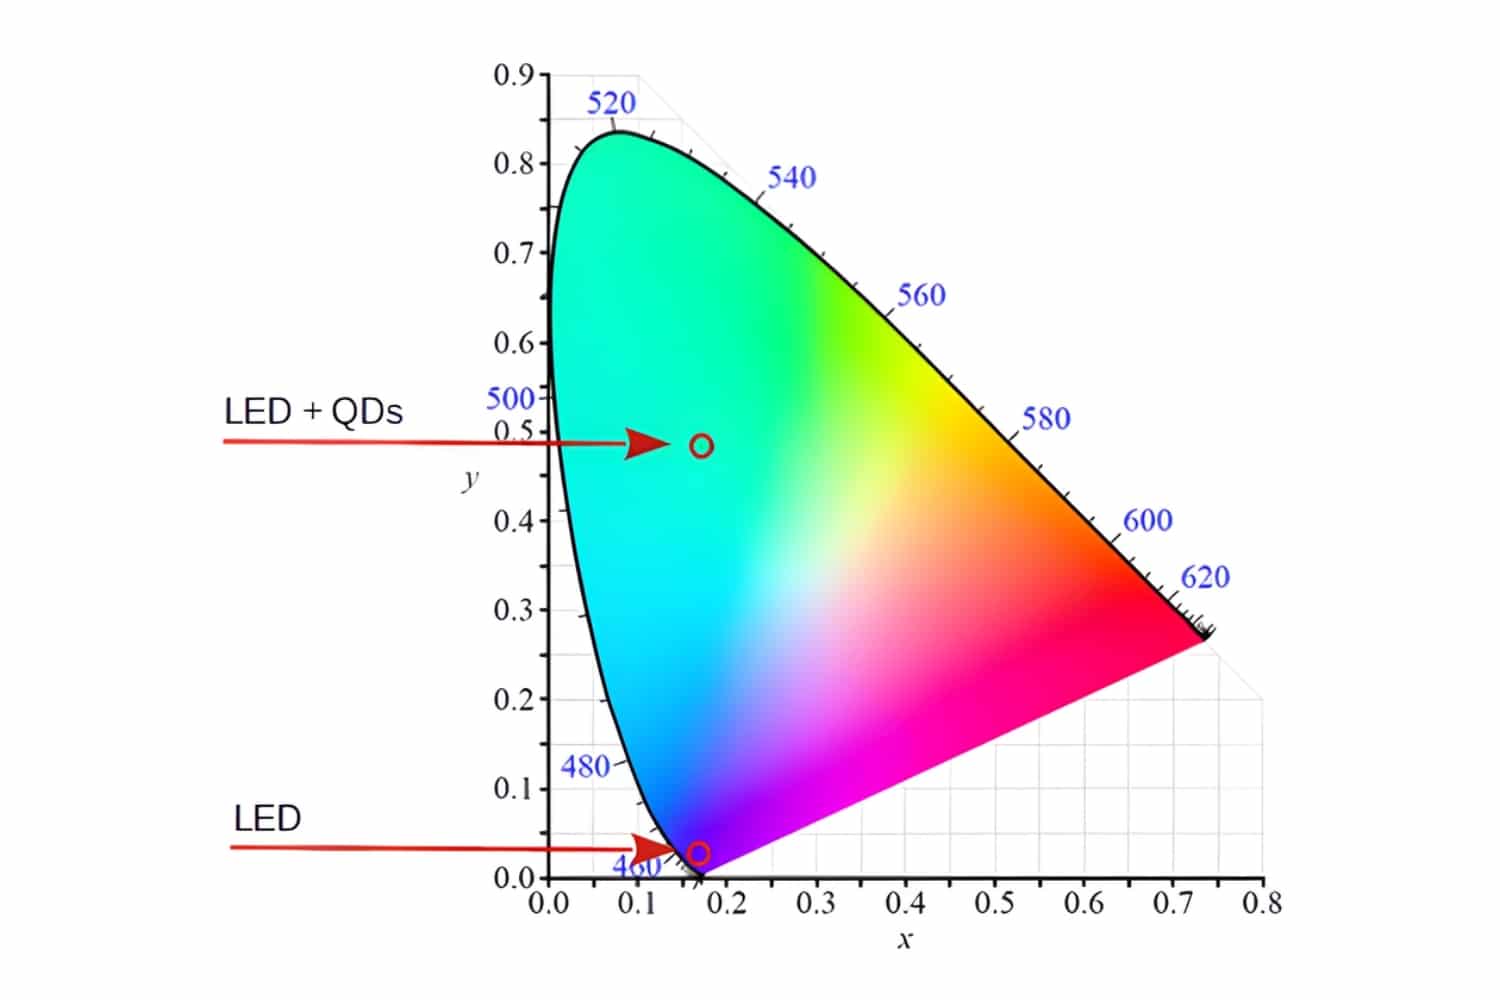
Steady-state spectra, time-resolved photoluminescence, and time-resolved electroluminescence were combined to analyze a hybrid quantum dot LED. While spectral data show overlapping emission from QDs and LED die, TRPL and TREL resolve carrier lifetimes and recombination pathways. All measurements were conducted using the FluoTime 300 spectrometer.
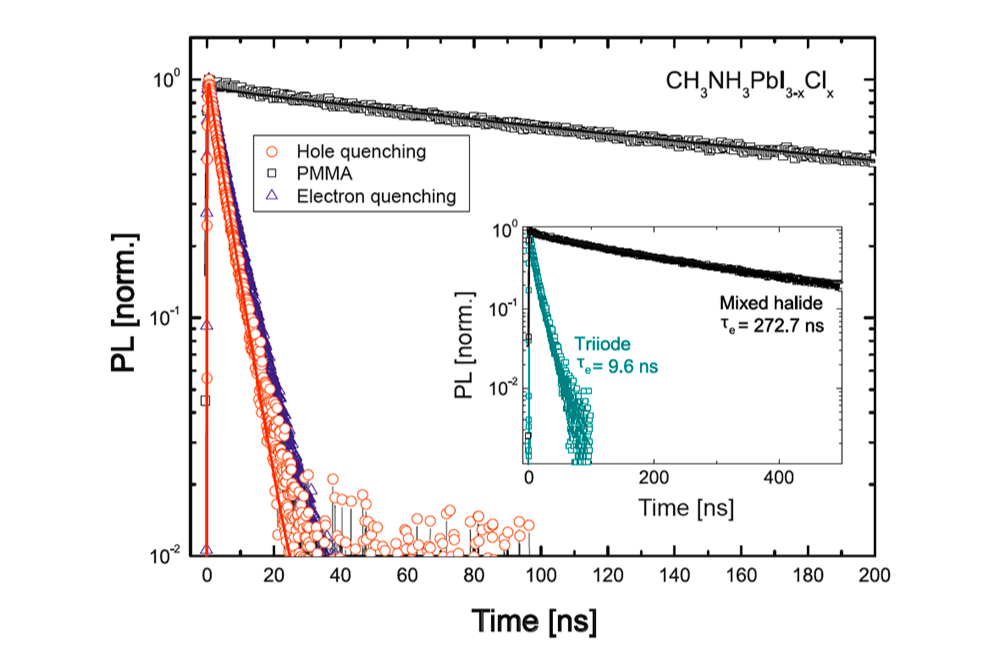
Selective electron and hole transport layers were used in TRPL quenching experiments to determine diffusion lengths in mixed-halide and triiodide perovskite films. Distinct decay dynamics correlate with charge-carrier transport and device efficiency. Measurements were performed using the FluoTime 300 photoluminescence spectrometer.
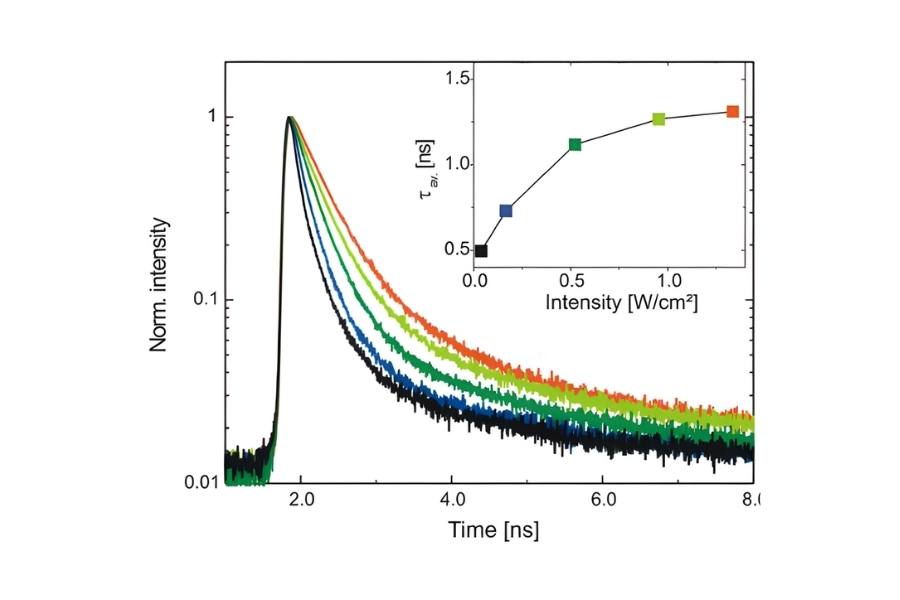
Spectrally and spatially resolved TRPL was used to investigate GaAsP quantum well structures, revealing layer-specific carrier lifetimes and recombination pathways. Intensity-dependent decay analysis enabled mapping of diffusion processes and interface quality at sub-nanosecond resolution. Experiments utilized the MicroTime 100 microscope and the FluoTime 300 spectrometer.
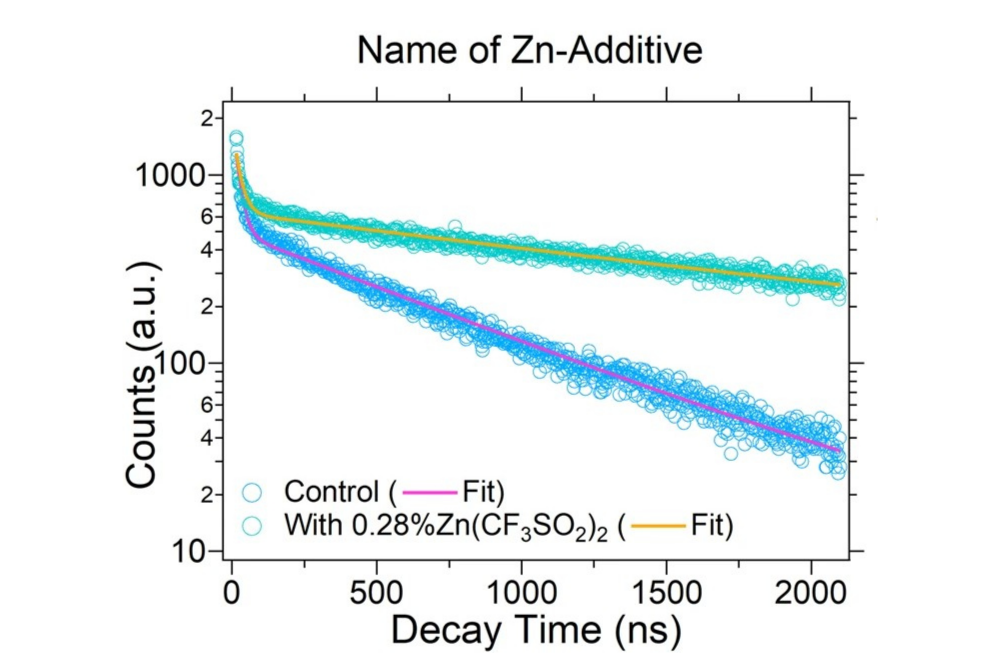
TRPL measurements of blade-coated perovskite films treated with Zn(OOSCF₃)₂ demonstrate a threefold increase in carrier lifetime and improved photoluminescence quantum yield, indicating effective defect passivation. These insights supported fabrication of minimodules achieving 19.6% certified efficiency. Measurements were performed using the FluoTime 300 and MicroTime 100 systems.
A steady-state spectroscopy method that measures the intensity of light emitted from a material under continuous excitation. It provides insights into electronic band structure, defect states, and optical quality but does not capture temporal emission dynamics.
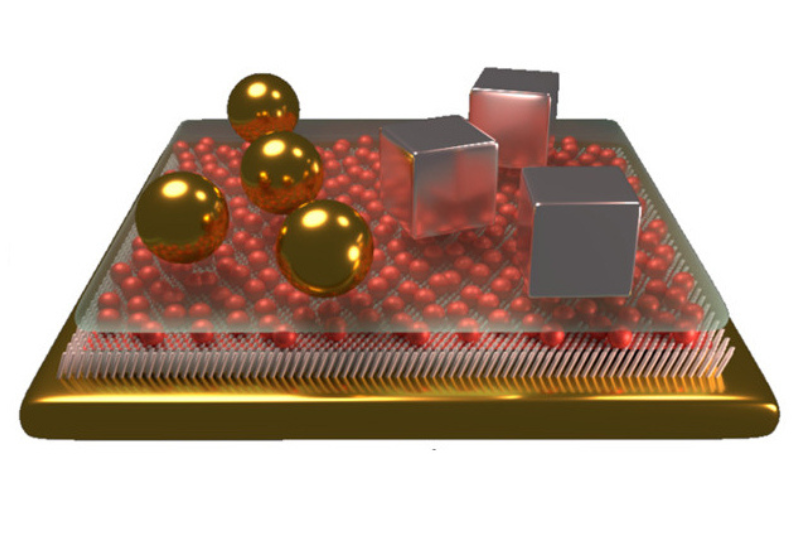
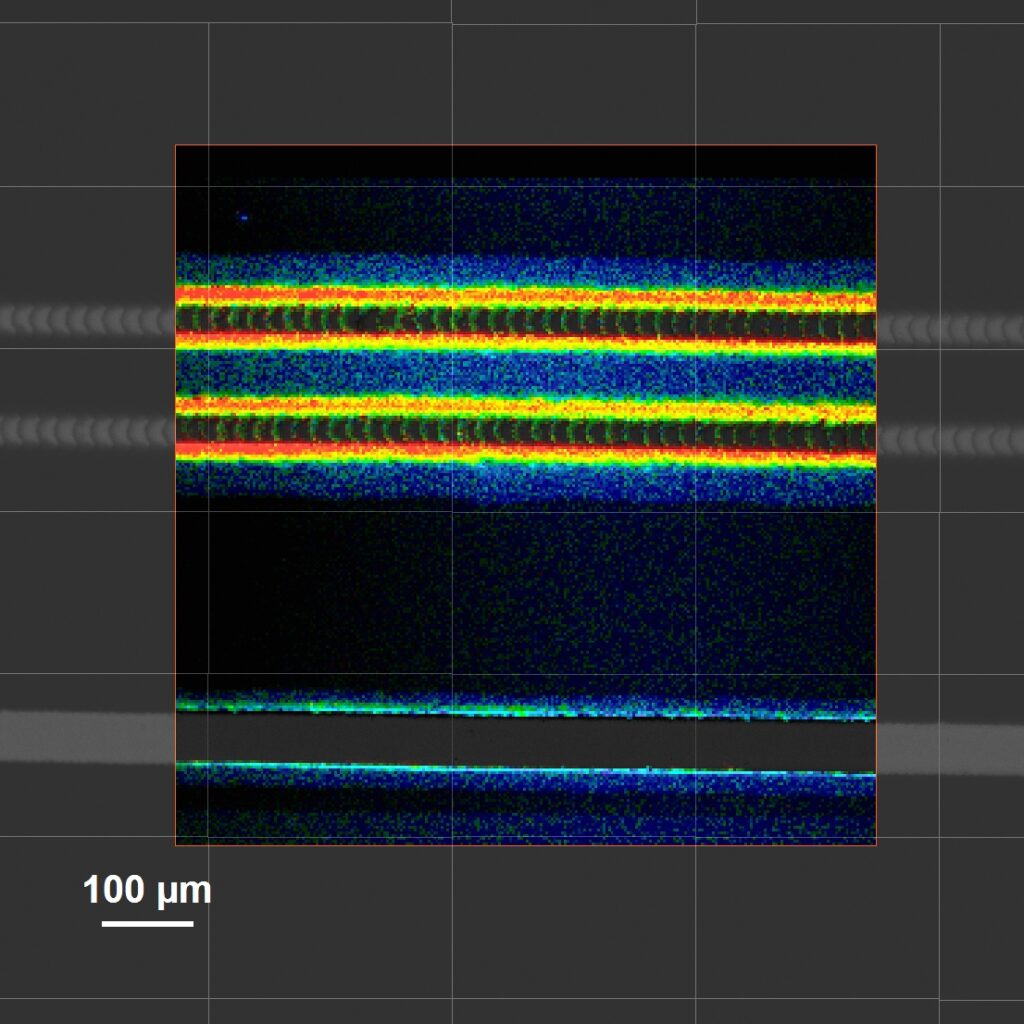
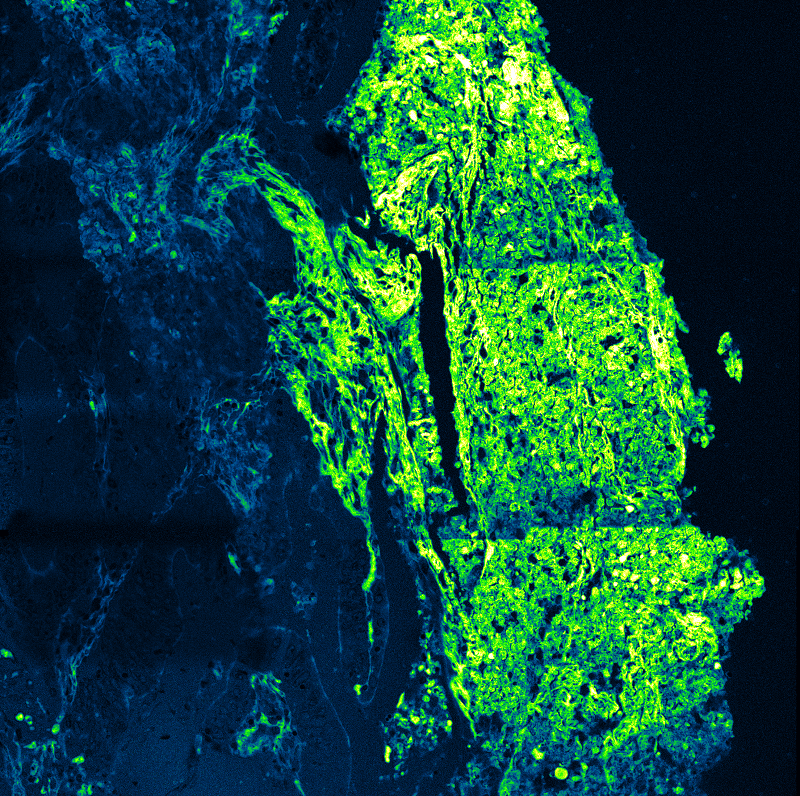
A spatially resolved spectroscopy method that maps photoluminescence decay dynamics across a sample following pulsed excitation. It reveals variations in carrier lifetimes, recombination pathways, and defect distributions with micrometer-scale resolution, enabling correlation of temporal emission properties with material morphology.