Life Science
Foerster Resonance Energy Transfer (FRET)
Lifetime-based FRET measurements can generate FLIM-FRET images by recording changes in a FRET pairs’ fluorescence lifetimes
FRET is a non-radiative process whereby energy from an excited fluorescent molecule (Donor) is transferred to a second, non-excited fluorophore (Acceptor) in its direct vicinity. FRET is used as a molecular ruler due to its sensitivity in the range of 2-10 nm. The energy transfer results in donor quenching and leads to changes in the fluorescence intensity and the fluorescence lifetimes of the two fluorophores. As a prerequisite, the donor is usually directly excited whereas direct excitation of the acceptor should be avoided.
The following conditions must be met for FRET:
- The donor fluorophore should have a sufficiently long lifetime for energy transfer to occur.
- The distance between donor and acceptor molecules must be approximately within the range of the Foerster radius R0.
- The absorption spectrum of the acceptor fluorophore must sufficiently overlap the fluorescence emission spectrum of the donor fluorophore.
- For energy transfer, the donor and acceptor dipole orientations must be approximately parallel.
In contrast to standard FRET measuring changes of the fluorescence intensity, lifetime-based FRET enables quantitative analysis by using the fluorescence lifetime of the donor molecule as a probe, that is in a broad range, concentration independent. This is crucial since in biological systems like cells the fluorophore concentration often cannot be accurately determined and compared amongst different cells. The fluorescence lifetime of the donor is effectively decreased (quenched) when it undergoes FRET with an acceptor molecule. Thus, comparing the donor lifetime in the absence and presence of the acceptor provides information about the FRET efficiency. The FRET efficiency E as a measure of the donor quenching can be calculated as:
E = 1- (τDA /τD)
τDA = Lifetime of the donor in presence of the acceptor, τD = Lifetime of the donor without acceptor
Acceptor photobleaching FRET is a special variant based on measuring the donor lifetime before and after destroying the acceptor. This photobleaching eliminates the energy transfer between the two fluorophores resulting in an increased donor fluorescence and lifetime indicative for FRET.
more...
 Contact us
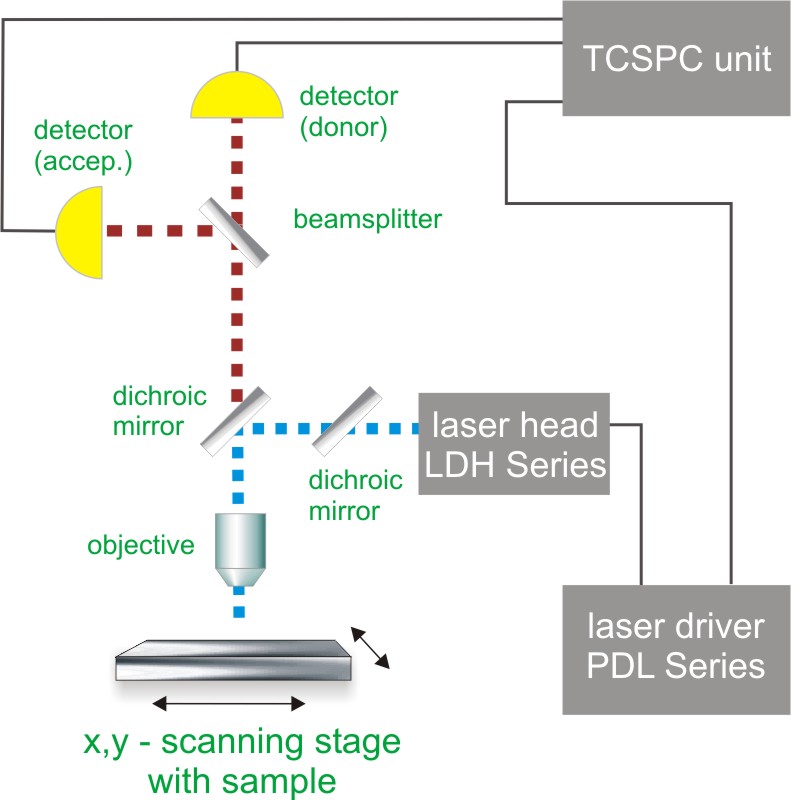
 Time-Correlated Single Photon Counting (TCSPC) is used to determine the fluorescence lifetime and consequently the amount of FRET. In TCSPC, one measures the time between sample excitation by a pulsed laser and the arrival of the emitted photon at the detector. TCSPC requires a defined “start”, provided by the electronics steering the laser pulse or a photodiode, and a defined “stop” signal, realized by detection with single-photon sensitive detectors (e.g. Single Photon Avalanche Diodes, SPADs). The measurement of this time delay is repeated many times to account for the statistical nature of the fluorophores emission. The delay times are sorted into a histogram that plots the occurrence of emission over time after the excitation pulse.
In order to acquire a FLIM-FRET image, the photons have to be attributed to the different pixels, which is done by storing the absolute arrival times of the photons additionally to the relative arrival time in respect to the laser pulse. Line and frame marker signals from the scanner of the confocal microscope are additionally recorded in order to sort the time stream of photons into the different pixels.
Consequently the essential components of a FLIM-FRET set-up are:
- pulsed laser source (diode lasers or multi-photon excitation)
- single photon sensitive detector
- dichroic mirror (to separate fluorescence signal from excitation light)
- objective (to focus the excitation light into the sample and collect fluorescence signal)
- TCSPC unit to measure the time between excitation and fluorescence emission
- scanner for FLIM-FRET imaging
Related technical and application notes:
- Application note: Imaging of molecular distances using FLIM-FRET
- Application note: Fluorescence Lifetime Imaging (FLIM) in Confocal Microscopy
- Application note: FRET analysis with Pulsed-Interleaved Excitation (PIE)
The following PicoQuant systems provide access to FLIM-FRET experiments
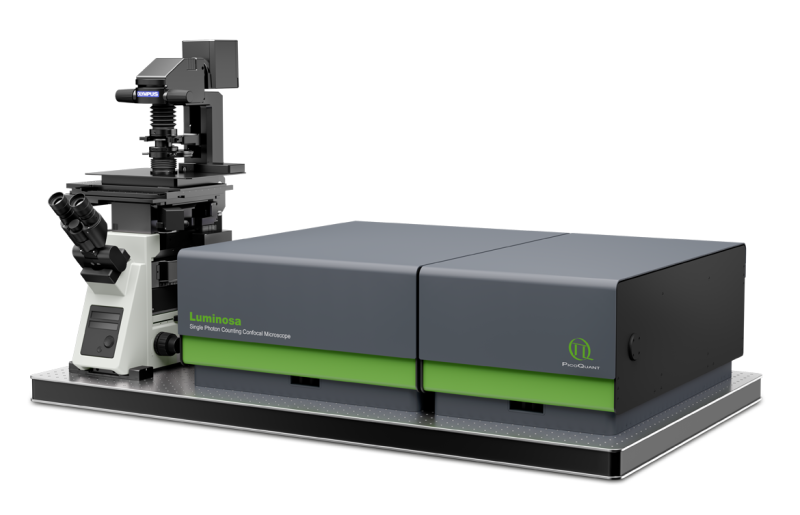
 Luminosa
Single Photon Counting Confocal Microscope
Luminosa combines state-of-the-art hardware with cutting edge software to deliver highest quality data while simplifying daily operation. The software includes context-based workflows for FLIM, FRET, and FCS, which allow the users to focus on their samples. Tight integration of hardware and software enable automated routines, e.g., for auto-alignment or laser power calibration, which increase ease of use as well as reproducibility of experiments. Still, an open mode of operation is available for full access to every optomechanical component via software.
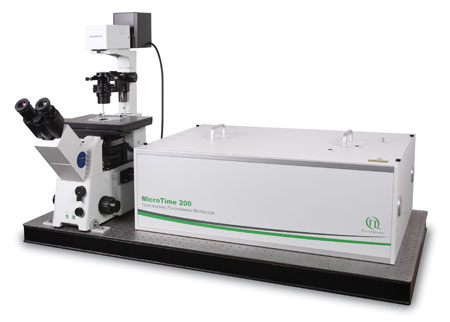
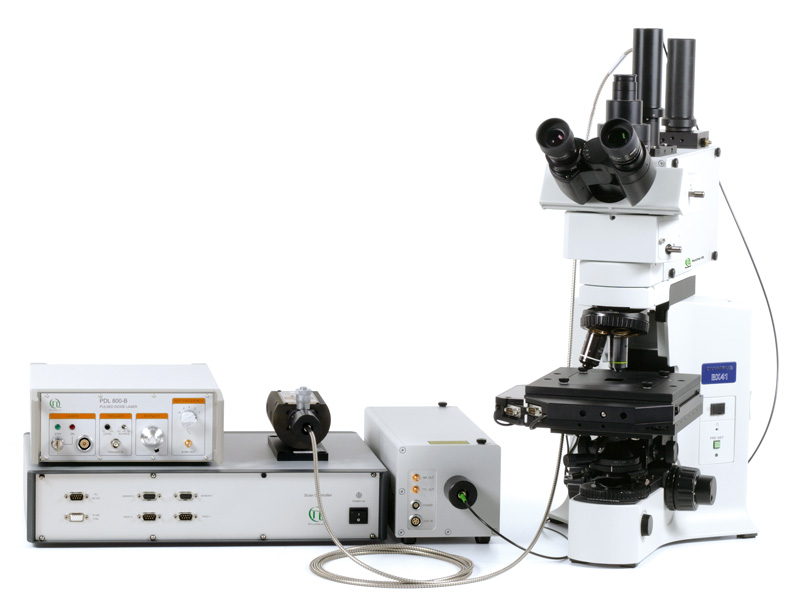
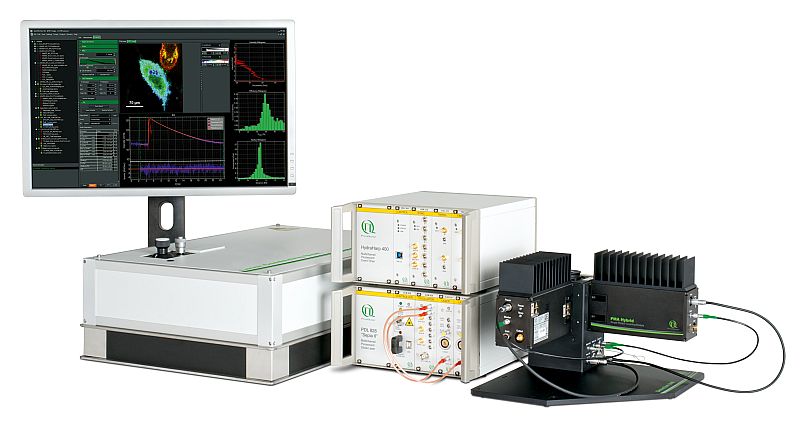
 MicroTime 200
Modular, time-resolved confocal fluorescence microscopy platform
The MicroTime 200 time-resolved fluorescence microscope system is a powerful instrument capable of Fluorescence Lifetime Imaging (FLIM) with single molecule detection sensitivity as well as Fluorecence Corelation Spectroscopy and its daughter techniques. It contains the complete optics and electronics for recording virtually all aspects of the fluorescence dynamics of microscopic samples or femtoliter volumes. The instrument gains its exceptional sensitivity and flexibility in combination with unprecedented ease-of-use from a unique fusion of miniaturized and highly sophisticated state-of-the-art technologies. Although, these technologies enable to run an instrument of comparable complexity and power without having to spend more time on instrument maintenance than on original scientific content, the MicroTime200 remains an open platform that allows the advanced scientist to easily built upon the open character of the instrument in order to realize highly customized applications
 LSM Upgrade Kit
LSM Upgrade Kits from PicoQuant add time-resolved capabilities to laser scanning microscopes from many major manufactures
Confocal Laser Scanning Microscopes (LSMs) are widely used tools in cell and molecular biology, biochemistry and other related sciences. PicoQuant's LSM Upgrade Kits greatly enhance the capabilities of these microscopes by extension to time-resolved techniques, and thereby providing not only Fluorescence Lifetime Imaging (FLIM) but also Fluorescence Correlation Spectroscopy (FCS) and a wealth of other time resolved techniques. The LSM Upgrade Kit combines PicoQuant products to a ready-to-use kit that fits your specific application on a state of the art Laser Scanning Microscope of your choice from Leica, Nikon, Olympus or Zeiss.
 MicroTime 100
Upright time-resolved confocal microscope
The upright time-resolved microscope MicroTime 100 contains the complete optics and electronics for recording FLIM, FCS as well as fluorescence decays in small volumes by means of Time-Correlated Single Photon Counting (TCSPC). The system is based on a conventional upright microscope body that permist easy access to a wide range of sample shapes and sizes.
The following core components are needed to build a system capable of FLIM-FRET measurements, which are (partly) available from PicoQuant:
- Laser drivers
- Laser or LED heads
- Photon Counting Detector
- TCSPC and MCS Electronics
- Analysis software
- Scanning device
- Galvo- or Piezo-Scanner
- Confocal optics
The process of energy transfer is strongly dependent on the distance between the donor and acceptor molecules and can usually only occur in the range of several nanometres. Thus, FRET permits fluorescence measurements beyond the theoretical resolution limit of optical microscopy. Hence, this technique allows to measure intra- and intermolecular distances and to study the binding of reaction partners in vitro and even in living cells. By targeting cellular constituents with fluorescent dyes, fluorescent antibodies and/or fluorescent proteins (GFP and related probes), almost any molecule can be labeled. Thus, FRET is used for investigating and quantifying interactions in signal transduction, the formation of protein complexes, protein-protein interactions, receptor function, membrane dynamics and molecular spatial relationships.
In addition, so-called FRET sensors allow the monitoring of environmental conditions such as pH and ion concentration by means of intramolecular FRET due to strong conformational changes.
Finally, single-pair FRET (spFRET) measured at the single molecule level reveals conformational changes of molecules by analyzing intramolecular distances, intermolecular interactions and dynamics on the nanoscale under physiologically relevant conditions (link zu PIE-FRET). These experiments are performed on immobilized molecules as well as on molecules in solution and are refined by Multi-Parameter Fluorescence Detection (MFD).
Other general applications for FRET measurements include:
- Spatial distribution and assembly of protein complexes
- Receptor/ligand interactions
- Probing interactions of single molecules
- Structural and conformational changes of nucleic acids
- Detection of nucleic acid hybridization
- Primer-extension assays for detecting mutations
- Automated DNA sequencing
- Distribution and transport of lipids
- ...
Using FLIM-FRET microscopy for the detection of protein-protein interactions in living plant cells
 A. thaliana and N. benthamiana, both relatives of important crop plants such as rape seed or tobacco, are well known model organisms for especially molecular, cell biological and physiological research in plants. FLIM-FRET measurements can give important insights into molecular interactions within living plant cells independent from the site of the interaction (cell membrane, mitochondria, nucleus, vacuole). The interaction complexes can be either heterologous, between different types of proteins, or homologous, if the same protein is forming a homomer; both will lead to a fluorescence lifetime reduction of the donor fluorophore.
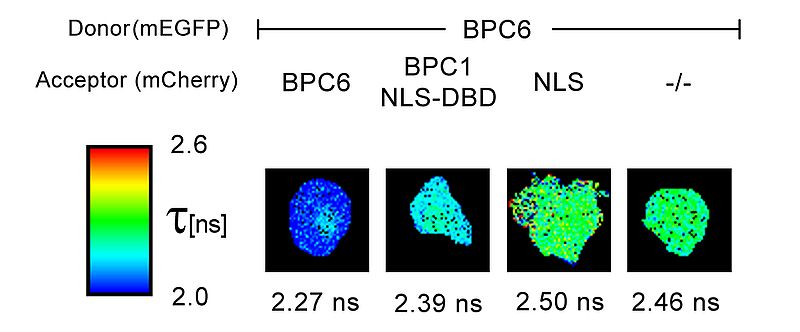
An example for the usage of FLIM-FRET measurements in plant research is the interaction analysis of the transcription factor BPC6. Plant cells derived from N. benthamiana leaves were transformed with a 2in1 plasmid expressing either two BCP6 proteins fused with either mEGFP or mCherry, respectively; or, alternatively, BCP6 fused to the donor mEGFP and a possible interaction partner coupled with the acceptor mCherry. The FLIM data were fitted pixel-by-pixel using a mono-exponential decay function. The resulting FLIM images indicate fluorescence lifetime changes colour-coded by a heatmap. BPC6 forms a homomer and interacts with the DNA binding domain of BPC1, another transcription factor, indicated by the observed lifetime reduction. In contrast, no lifetime decrease was observed in a control experiment using a nuclear localization signal (NLS) fused to the acceptor fluorophore mCherry. The resulting FLIM image is comparable to the donor only lifetime. (-/-).
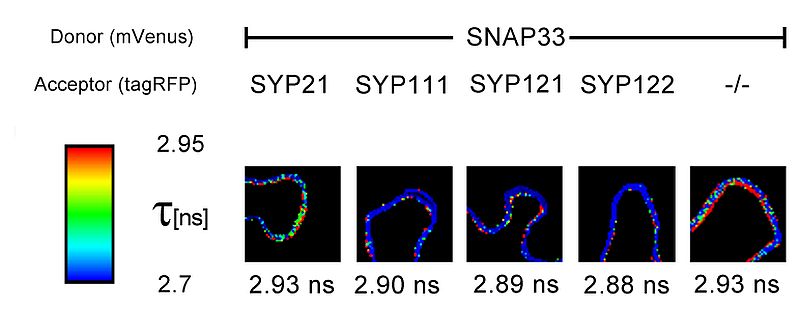
 FLIM measurements also revealed interesting results of protein-protein interactions within the plasma membrane (PM) of living N. benthamiana cells. The SNARE protein SNAP33 which is membrane attached, possibly through myristoylation, was fused to the donor fluorophore mVenus. SNAP33-mVenus was either cotransformed with tagRFP coupled to the vacuolar membrane SNARE SYP21, or SYP111, SYP121 or SYP122 all of which are plasma membrane localised. The donor lifetime reduction with SYP111, SYP121 or SYP122 indicated that SNAP33 interacts with these proteins. In contrast, coexpression of SNAP33 and SYP21, or the negative control tagRFP (-/-), respectively, did not lead to a reduction of the donor lifetime, corroborating that SYP21 does not interact with SNAP33 and that the decrease in the lifetime of SNAP33-Venus is not due to the presence of tagRFP alone.
Set-up:
- Leica TCS SP8 SMD with a FLIM & FCS Upgrade Kit from PicoQuant
- TCSPC electronics: PicoHarp 300
- Excitation: picosecond pulsed 470 nm (LDH-P-C-470)
- Emission: PMT, BP 495-530 nm
Data courtesy of Christopher Grefen and Klaus Harter, University of Tübingen, Germany
Reference: A. Hecker et al., Plant Physiology, July 2015, Vol. 168, pp. 776–787
Lifetime-based FRET measurement allows characterizing intra-nulear dimer formation of the transcription factor C/EBP in living mouse cells
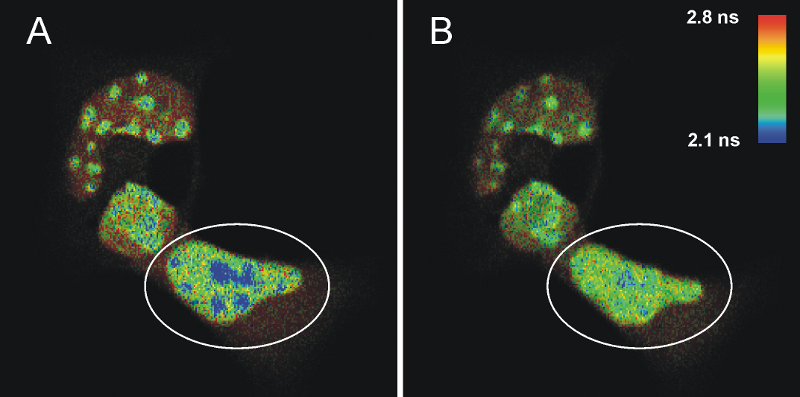
FLIM-FRET measurements of cells transfected with ECFPF46L, A206K-C/EBPα DBD and EYFPF46L, A206K-C/EBPα DBD before (A) and after photo-bleaching (B) of the FRET-acceptor EYFP. The donor fluorescence originating from ECFP is shown, the fluorescence lifetime is indicated by the false color representation.
 Fig. A shows a heterogeneous FLIM image of cells containing areas with high signal intensity that represent pericentric heterochromatin regions. The FRET process is identified in the blue colored areas where the fluorescence lifetime of the donor ECFP is decreased compared to the lifetime of a sample without acceptor (2.1 ns compared to 2.4 ns on average). This strongly indicates that C/EBPα DBD dimerizes specifically at pericentric heterochromatin. To prove this, EYFP was photo-bleached in one cell (marked by a circle in Fig. A) by repetitive scanning using a 514 nm cw laser. After photo-bleaching of the acceptor, it is obvious that the number of pixels corresponding to a fluorescence lifetime below 2.2 ns were significantly reduced, whereas the fluorescence lifetime of the donor in other cellular regions was unaffected (Fig. B). The average donor fluorescence lifetime distribution in the acceptor bleached cell is more homogeneous, thus, indicating that the shorter measured average ECFP-lifetimes in pericentric heterochromatin have been caused by FRET.
Set-up:
- Olympus FluoView FV1000 with LSM Upgrade Kit
- Excitation: 470 nm, 40 MHz repetition rate
- Emission: 500 - 560 nm
- Analysis: SymPhoTime
- Image size: 512 x 512 pixel
Sample courtesy of Ammasi Periasamy, University of Virginia, Charlottesville, VA, USA
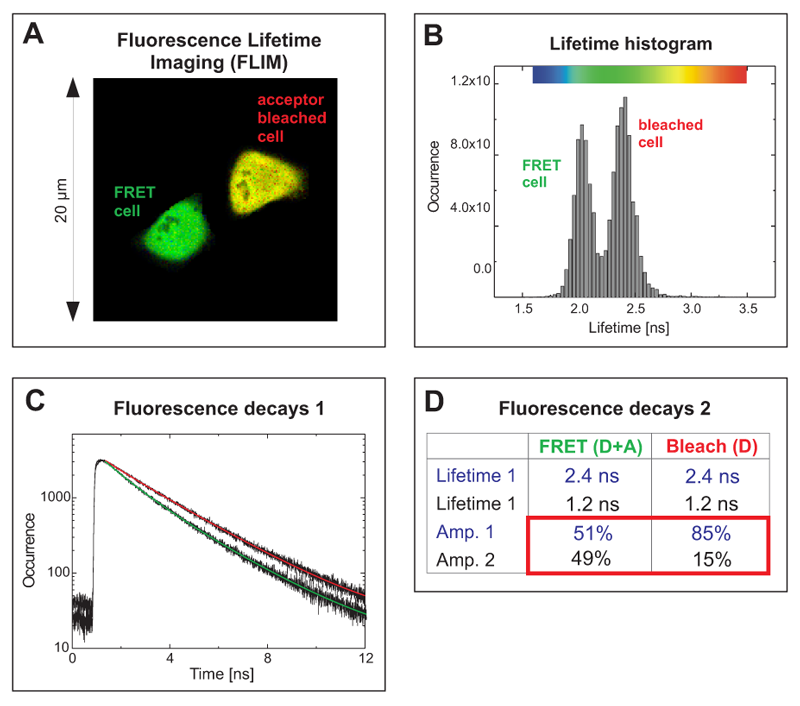
Acceptor photobleaching FLIM-FRET experiment of cells expressing a EGFP-RFP tandem protein using two-photon excitation
The cells expressed a EGFP-RFP fusion construct where both fluorophores were separated only by a short linker. Such a donor-acceptor fusion serves as a positive control for FRET.
The FLIM image in Fig. A shows two cells with different average donor lifetimes indicated by a false color representation: a FRET cell and a cell where the acceptor RFP was irreversibly bleached leading to a lifetime shift from approximately 2.1 ns towards 2.4 ns. This shift of the average lifetime could b e clearly distinguished in the lifetime histogram by means of two peaks corresponding to both cells (Fig. B). The TCSPC histogram represents both fluorescence decays from the FRET and the bleached cell (Fig. C). By fitting them to a bi-exponential decay model, for each cell two lifetimes could be calculated (Table in Fig. D). The value of 2.4 ns corresponds to unquenched EGFP, whereas the second lifetime of 1.2 ns represents EGFP molecules that are quenched by FRET. A comparison of the relative amplitudes revealed that the ratio of both lifetime components in the FRET cell is almost 1 to 1 (amplitude 1 ~51%, amplitude 2 ~49%). This indicates that half of the EGFP-RFP fusion proteins could adopt a proper conformation due to complete maturation allowing for FRET. When analysing the acceptor-bleached cell the situation was different. Only 15% of the EGFP molecules were quenched by energy transfer to some remaining acceptor molecules whereas the majority of donor molecules (85%) could not undergo FRET any more because an appropriate acceptor molecule was missing.
Set-up:
- Leica TCS SP5 with LSM Upgrade Kit
- Excitation: two-photon excitation at 850 nm, 80 MHz repetition rate
- Emission: 500 - 540 nm
- Analysis: SymPhoTime
- Image size: 256 x 256 pixel
Sample courtesy of Dirk Daelemans and Thomas Vercruysse, Rega Institute for Medical Research, Katholieke Universiteit, Leuven, Belgium
Single and dual channel lifetime FRET imaging of the human kinetochore proteins CENP‑A and CENP‑B
An absence of FRET does not indicate that the fluorescently tagged molecules are not interacting. Amongst other reasons like unfavourable dipole orientation of the fluorophores, the acceptor molecule could be absent. Its presence within the sample can be directly proven by a dual-channel detection set up, thus allowing to exclude these artefacts.
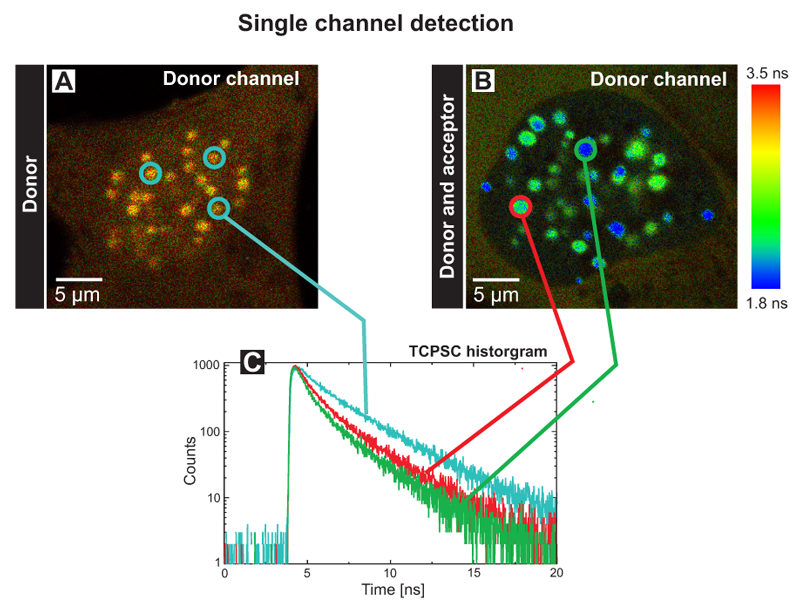
 The FLIM images of human U2OS cells transfected with the donor CENP‑B‑Cerulean (A) or additionally with the acceptor EYFP‑CENP‑A (B) display the donor fluorescence lifetime (Single channel detection). Both kinetochore proteins have been tagged with Cerulean and EYFP at its C‑ and N‑terminus, respectively and display a punctual localisation at centromeres in the cell nucleus. The measurements have been performed in transiently transfected living human cells.
The blue decay curve in the TCSPC histogram (C) corresponds to the three blue-circled centromeres of the control cell with an average donor lifetime of 2.9 ns (A). The green and red lines represent fluorescence decays of the indicated centromeres in the FRET cell with quenched average fluorescence lifetimes of 1.8 ns and 2.2 ns, respectively (B). Thus, one can conclude that both proteins are in direct vicinity in human kinetochores. In the control cell, a homogeneous and longer average fluorescence lifetime could be determined in all centromeres, in the double transfected cell, the fluorescence lifetimes varied amongst different complexes. These centromere specific lifetimes are most probably caused by different ratios of incorporated fluorescently labeled CENP A and ‑B molecules and do not reflect different complex structures at individual chromosomes.
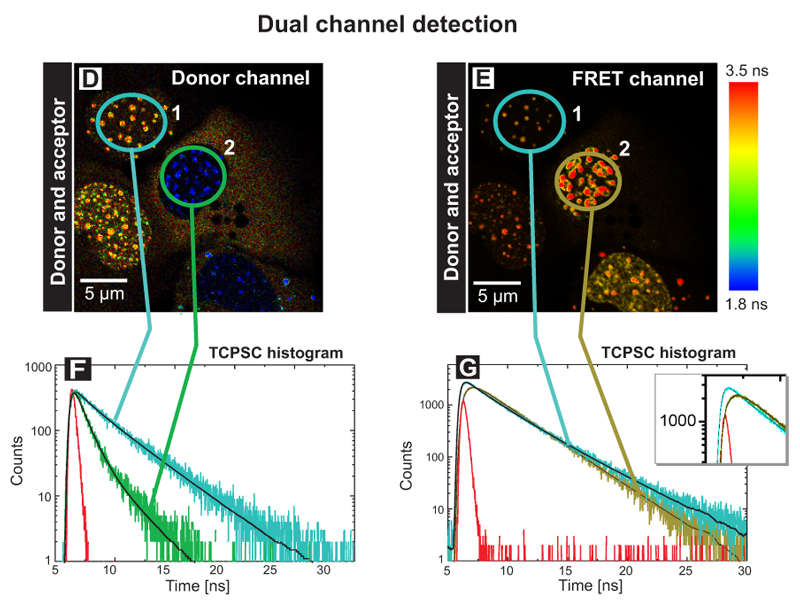
 A similar experiment was performed using two detectors to monitor the fluorescence lifetime of both the donor (Fig. D) and acceptor (Fig. E) fluorophores simultaneously after excitation of the donor at 440 nm (Dual channel detection). In the donor channel a bandpass filter BP 480/40 limited the detection to the Cerulean fluorescence only (D). In the FRET channel a longpass filter LP 530 allowed to record the acceptor fluorescence indirectly caused by FRET (E). In this way the set up allows to directly prove the acceptor presence. The TCSPC histograms display the fluorescence decays of cell 1 and 2 in the corresponding channels (F, G). Cell 1 marked with a blue circle contained only the donor CENP-B-Cerulean. At all centromeres, the analysis yielded an average fluorescence lifetime of 3.0 ns (see blue trace in Fig. F). The weak fluorescence seen in the FRET channel was caused by spectral bleed through. In cell 2 both the donor and acceptor molecules were present. In the donor channel the quenching of the lifetime down to 1.2 ns caused by FRET is indicated by the blue color of all centromeres resulting in a FRET efficiency of 60%. In the FRET channel strong fluorescence of the acceptor EYFP‑CENP‑A was detected. The analysis yielded a value of approximately 2.8 ns corresponding to the fluorescence lifetime of EYFP (dark green trace in Fig. G). In addition a rise time of around 0.5 ns was observed (see enlargement in the TCSPC histogram). This delay of acceptor emission was caused by energy transfer between the donor and acceptor. With these experiments it could be demonstrated that both the N-terminus of CENP‑A and the C-terminus of CENP‑B are in very close vicinity in human centromeres.
Set-up:
- Olympus FluoView FV1000 with LSM Upgrade Kit
- Excitation: 440 nm, 20 MHz repetition rate
- Emission: 460 - 500 nm
- Analysis: SymPhoTime
- Image size: 512 x 512 pixel
Sample courtesy of Sandra Orthaus, Leibniz Institute for Age Research, Fritz Lipmann Institute, Jena, Germany
Differentiating between quenched and unquenched donors by means of FLIM-FRET experiments
 Compared to lifetime-based FRET measurements, intensity-based FRET is unable to distinguish if within a molecule ensemble energy is transferred from all donor molecules with low FRET efficiency (e.g. due to distances larger than the Förster radius), or if only a few donor molecules are tightly bound into the complex resulting in high energy transfer between donor and acceptor. Although in both cases the average donor lifetime quenching would be identical, FLIM-FRET is able to reveal those sub-populations; thus, allowing to determine the fraction of free donors compared to associated donor molecules within a complex.
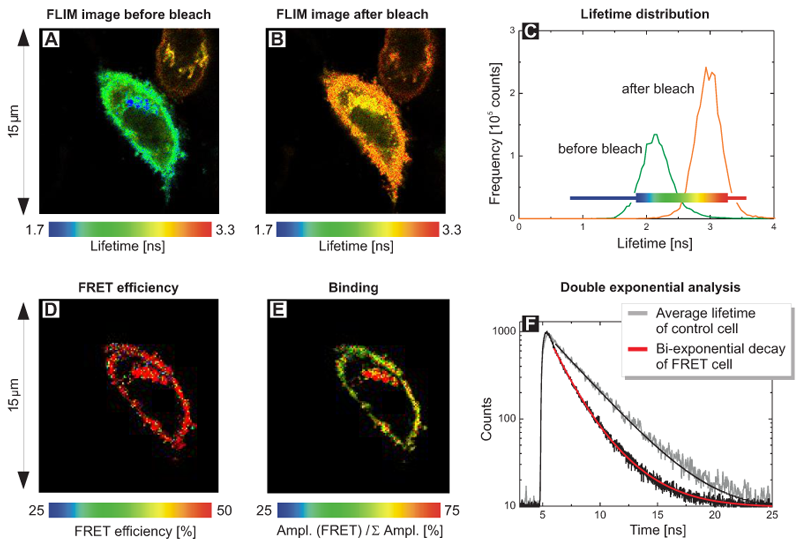
FLIM images of living 12V HC Red cells expressing a fusion protein of EGFP (donor) and RFP (acceptor) separated by a short linker were acquired. The FLIM images monitor the donor fluorescence lifetime before (A) and after photo-bleaching of the acceptor RFP (B) using a 568 nm cw laser. A stronger FRET process can be identified in (A) in the blue colored area. The lifetime distribution (C) reveals the quenching of the average lifetime from 2.9 ns towards 2.2 ns due to FRET.
In the pre-bleach image, a cellular region with significantly shorter donor lifetimes as indicated by the blue colored area was identified. To evaluate the reason for this stronger FRET quenching, a scripting based FLIM-FRET analysis with a double exponential decay model was performed yielding a FRET efficiency image (D) and an image of the amplitude ratio (E). Whereas the variation of the FRET efficiency was minimal, the ratios between quenched (bound) and unquenched (unbound) EGFP species differ indicating that in the region with the very short donor lifetimes, the ratio of quenched and unquenched EGFP molecules varied. The fitted shorter lifetime of 1.4 ns corresponds to FRET quenched donor molecules whereas the longer lifetime (3.0 ns) represents unbound donor only molecules (Fig. F). Apparent FRET changes within the cell are therefore mainly due to different ratios between unbound donor molecules and FRET pairs with almost the same FRET efficiency.
Set-up:
- Olympus FluoView FV1000 with LSM Upgrade Kit
- Excitation: 470 nm, 40 MHz repetition rate
- Emission: 460 - 500 nm
- Analysis: SymPhoTime
- Image size: 256 x 256 pixel
Sample courtesy of Philippe Bastiaens, MPI Dortmund, Germany.
Employing FLIM-FRET analysis to monitor localization-dependent protein binding
FLIM-FRET is often applied to detect sites of protein interactions within cellular structures. By using GFP and related fluorescent proteins, molecular interaction in the range of less than 10 nm is detectable, although the maximum optical resolution of the microscope is around 200 nm.
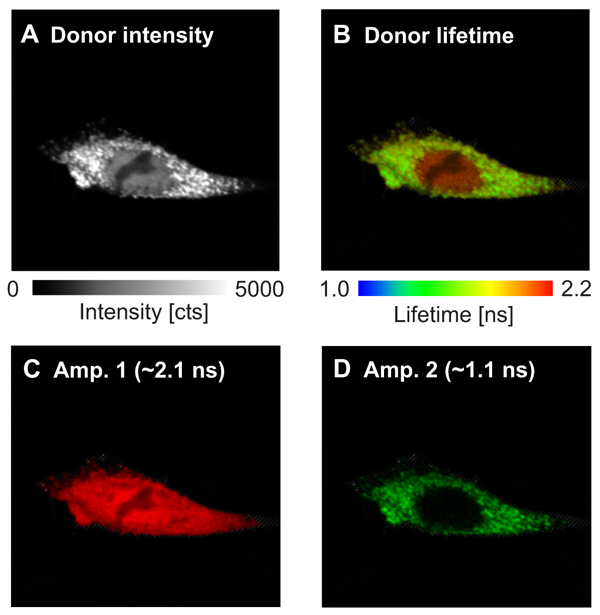
 In this example, the interaction sites between the two proteins WASP and Toca-1 were determined. Both proteins are involved in filopodia and vesicle formation and were labeled with GFP and RFP as donor and acceptor, respectively. The donor fluorescence intensity (Fig. A ) and donor fluorescence lifetime of GFP-N-WASP (Fig B) are shown. Based on the false color code in the FLIM image one can clearly recognize a donor lifetime decrease in the cytoplasm due to FRET. The data were fitted by a 2-exponential model and derived two lifetimes of 2.1 ns and 1.1 ns. The Amplitude 1 of the unquenched lifetime component (Fig. C) corresponds to free GFP-N-WASP molecules, whereas Amplitude 2 of the FRET quenched lifetime (Fig. D) represents bound GFP-N-WASP. This indicates a localization-dependent interaction of N-WASP and TOCA-1 in cytoplasmic vesicles, but not other cellular regions.
Set-up:
- Olympus FluoView FV1000 with LSM Upgrade Kit
- Excitation: 485 nm, 40 MHz repetition rate
- Emission: 500 - 540 nm
- Analysis: SymPhoTime
Sample courtesy of Sohail Ahmed, T. Sudhaharan, Institute of Medical Biology, Singapore
Multistep analysis of Foerster energy transfer in a single photonice wire featuring multiple FRET pairs
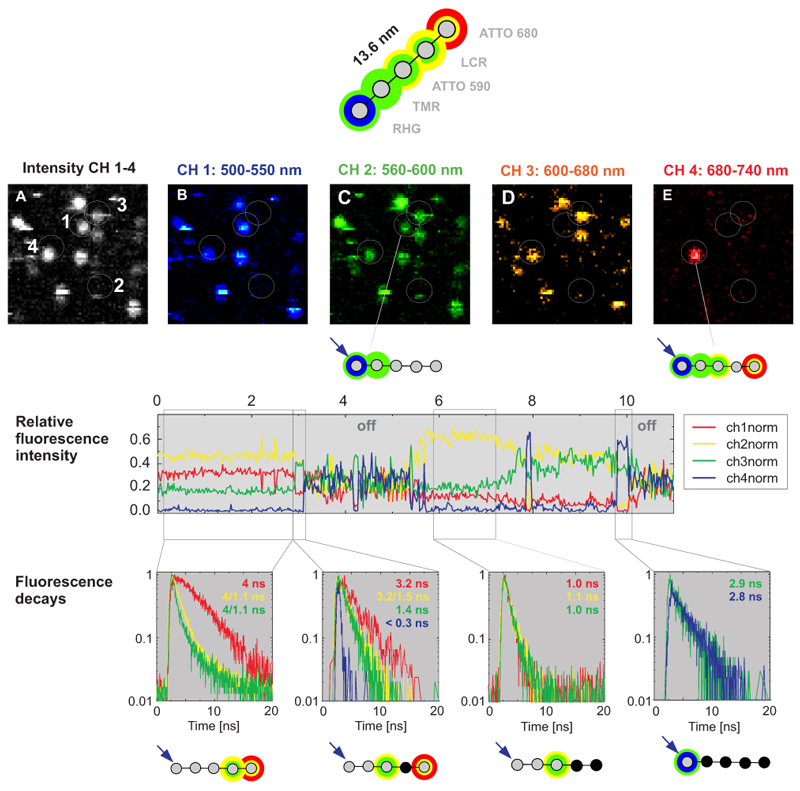
 Multistep FRET in a photonic wire was detected by Time-correlated Single Photon Counting (TCSPC). To generate a photonic wire, rigid DNA was stained with the five dyes RHG, TMR, ATTO590, LCR and ATTO680, spaced each by approx. 3.4 nm. The immobilized multichromophoric molecules were excited at 470 nm and, consequently, undergo step by step unidirectional FRET. The emission was detected in four spectrally separated channels (Fig. B-C). The photons can easily be contributed to the four spectrally different subpopulations which enables to calculate the FRET efficiency step by step. For example, the photonic wire marked with 4 in Fig. A undergoes FRET up to the last Atto680 dye but also shows some leakage for all single FRET steps. In contrast, a second photonic wire (marked with 1 in Fig. A) shows FRET only up the second dye.
After spectral splitting, the macroscopic time was used to monitor temporal intensity fluctuations (see relative fluorescence intensity). Due to the non trivial emission patterns of the involved dyes (spectral bleedthrogh of each dye into several detection channels) it is diffucult to determine the number of actually emitting dyes just from the intensity based information. However, every dye shows one dominant lifetime in a first approximation. Thus, by taking into account also the microscopic time seen as changes of the TCSPC histogram (fluorescence decay in the figure), it is possible to extract the number of involved emitters from the fluorescence lifetime decay. In this way, the simultaneous acquisition of fluorescence intensity and lifetime data allows to explain the complicated FRET mechanism in this multichromophoric system. Especially, nonfluorescing relaxation pathways can be investigated, because the lifetime senses this as a quenching of the radiative channels.
Set-up:
- MicroTime 200
- Excitation: 470 nm
- Emission: four channel detection (500 – 740 nm)
- Analysis: SymPhoTime
In collaboration with M. Heilemann, P. Tinnefeld, M. Sauer, University of Bielefeld, Germany
Latest 10 publications related to FRET
The following list is an extract of 10 recent publications from our bibliography that either bear reference or are releated to this application and our products in some way. Do you miss your publication? If yes, we will be happy to include it in our bibliography. Please send an e-mail to info@picoquant.com containing the appropriate citation. Thank you very much in advance for your kind co-operation.