Life Science
Pattern Matching Analysis
Advanced FLIM / STED analysis feature of the SymPhoTime 64 software which allows identifying and separating populations
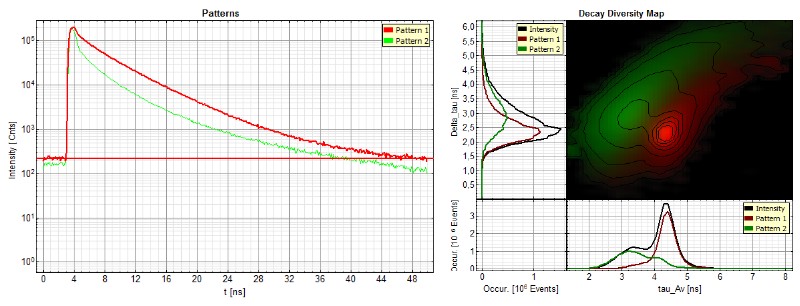
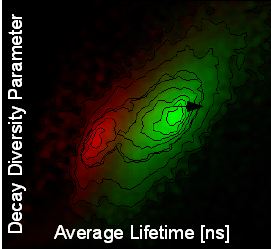
A pattern matching analysis is included in the SymPhoTime 64 software that permits an unambiguous identification and separation of different populations (like fluorophores, background and autofluorescence) in each image pixel. The fluorescence decay acts as fingerprints for specific fluorescence contributions and provides an excellent tool to analytically determine the fluorescence lifetime. This method allows to distinguish between e.g., different cell types and autofluorescence based on their individual overall fluorescence lifetime without the need of time-consuming data fitting. No information about the different contributions is necessary prior to analysis, one simply defines the decay “fingerprints” of the individual molecules (for example of the background or the different fluorescent molecules) within the FLIM or STED image or the scatter plot, which are then saved as “patterns”.The scatter plot (decay diversity map) is very intuitive with meaningful parameters like the average fluorescence lifetime, which is analytically determined and represents the center of mass of the average photon arrival times. The second plot parameter delta_tau indicates the number of exponentials or components that are included in the fluorescence decay. By pattern matching, the intensities of the defined patterns corresponding to the different species are determined in each image pixel. As a result, the pattern matching approach applying the full lifetime information fastens and refines FLIM and STED analysis. Specific regions within the sample which have been identified by this method could further be analyzed via multi-exponential fitting.
 Get in touch
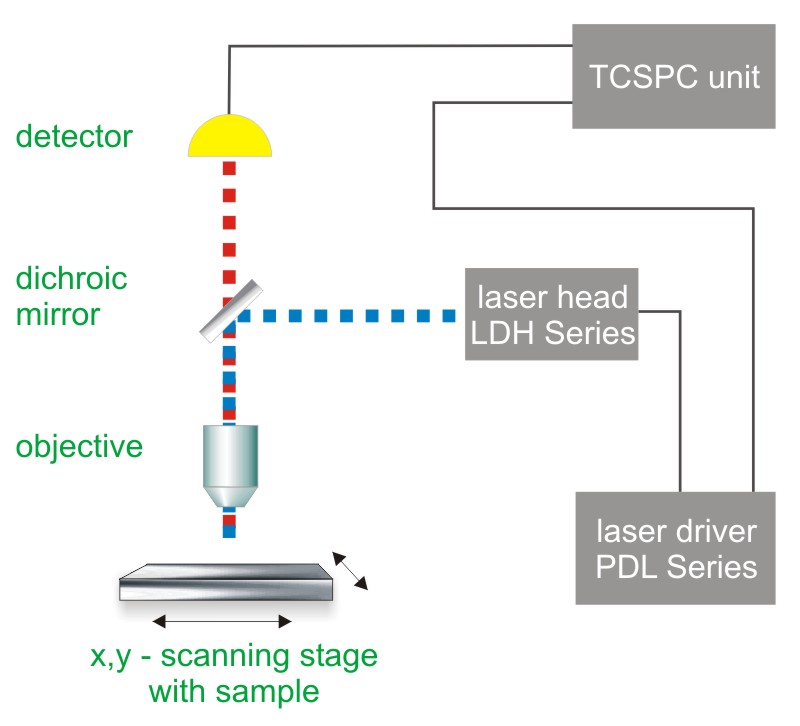
 Pattern matching is a special analysis feature for FLIM or STED. In both set-ups, Time-Correlated Single Photon Counting (TCSPC) is used to determine the fluorescence lifetime. In TCSPC, one measures the time between sample excitation by a pulsed laser and the arrival of the emitted photon at the detector. TCSPC requires a defined “start”, provided by the electronics steering the laser pulse or a photodiode, and a defined “stop” signal, realized by detection with single-photon sensitive detectors (e.g. Single Photon Avalanche Diodes, SPADs). The measurement of this time delay is repeated many times to account for the statistical nature of the fluorophores emission. The delay times are sorted into a histogram that plots the occurrence of emission over time after the excitation pulse.
In order to acquire a fluorescence lifetime image, the photons have to be attributed to the different pixels, which is done by storing the absolute arrival times of the photons additionally to the relative arrival time in respect to the laser pulse. Line and frame marker signals from the scanner of the confocal microscope are additionally recorded in order to sort the time stream of photons into the different pixels.
Consequently the essential components of a FLIM or STED set-up are:
- pulsed laser source (diode lasers or multi-photon excitation)
- single photon sensitive detector
- dichroic mirror (to separate fluorescence signal from excitation light)
- objective (to focus the excitation light into the sample and collect fluorescence signal)
- TCSPC unit to measure the time between excitation and fluorescence emission
- for STED: phase plate for transforming the STED pulse into a doughnut shape
The following systems from PicoQuant support pattern matching analysis for FLIM and STED experiments
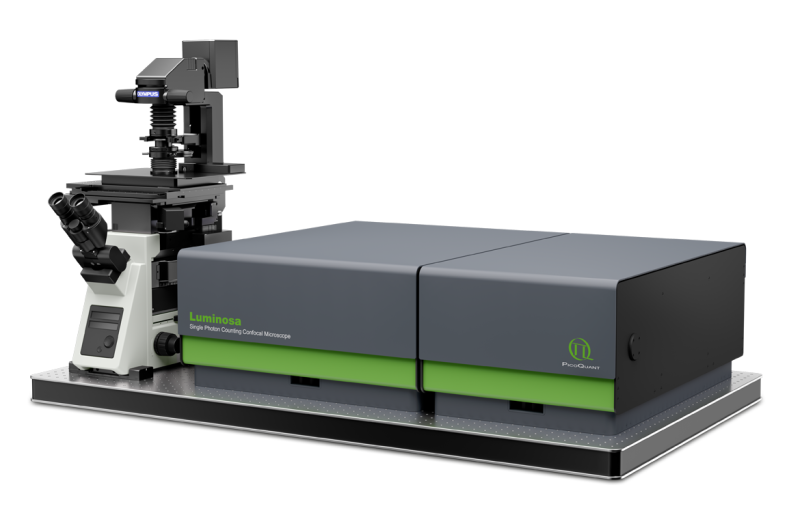
 Luminosa
Single Photon Counting Confocal Microscope
Luminosa combines state-of-the-art hardware with cutting edge software to deliver highest quality data while simplifying daily operation. The software includes context-based workflows for FLIM, FRET, and FCS, which allow the users to focus on their samples. Tight integration of hardware and software enable automated routines, e.g., for auto-alignment or laser power calibration, which increase ease of use as well as reproducibility of experiments. Still, an open mode of operation is available for full access to every optomechanical component via software.
 MicroTime 200
Modular, time-resolved confocal fluorescence microscopy platform
The MicroTime 200 time-resolved fluorescence microscope system is a powerful instrument capable of Fluorecence Corelation Spectroscopy and its daughter techniques as well as Fluorescence Lifetime Imaging (FLIM) with single molecule detection sensitivity. It contains the complete optics and electronics for recording virtually all aspects of the fluorescence dynamics of microscopic samples or femtoliter volumes. The instrument gains its exceptional sensitivity and flexibility in combination with unprecedented ease-of-use from a unique fusion of miniaturized and highly sophisticated state-of-the-art technologies. Although, these technologies enable to run an instrument of comparable complexity and power without having to spend more time on instrument maintenance than on original scientific content, the MicroTime200 remains an open platform that allows the advanced scientist to easily built upon the open character of the instrument in order to realize highly customized applications
 LSM Upgrade Kit
LSM Upgrade Kits from PicoQuant add FLIM capabilities to laser scanning microscopes from many major manufactures
Confocal Laser Scanning Microscopes (LSMs) are widely used tools in cell and molecular biology, biochemistry and other related sciences. PicoQuant's LSM Upgrade Kits greatly enhance the capabilities of these microscopes by extension to time-resolved techniques, and thereby providing not only Fluorescence Lifetime Imaging (FLIM) but also Fluorescence Correlation Spectroscopy (FCS) and a wealth of other time resolved techniques. The LSM Upgrade Kit combines PicoQuant products to a ready-to-use kit that fits your specific application on a state of the art Laser Scanning Microscope of your choice from Leica, Nikon, Olympus or Zeiss.
 MicroTime 100
Upright time-resolved confocal microscope
The upright time-resolved microscope MicroTime 100 contains the complete optics and electronics for recording F(C)CS or FLCS data as well as fluorescence decays in small volumes by means of Time-Correlated Single Photon Counting (TCSPC). The system is based on a conventional upright microscope body that permist easy access to a wide range of sample shapes and sizes.
The following core components are needed to build a system capable of FLIM / STED measurements, which are (partly) available from PicoQuant:
- Laser drivers
- Laser or LED heads
- Photon Counting Detector
- TCSPC Electronics
- Analysis software
- Scanning device
- Galvo- or Piezo-Scanner
- Confocal optics
- for STED: phase plate
Pattern matching analysis can be used for several application such as:
- Differentiation of endogenous protein fluorescence, e.g. for cancer detection
- Tissue analysis and differentiation
- Discrimination between different cell types
- Separation of staining from autofluorescence
- Multi-labeling without crosstalk
- FRET analysis to identify interaction sites in cells
- STED dual species separation
Using pattern matching analysis to study fast bead diffusion via rapidFLIM
The diffusion behavior of two types of dye-labeled beads was monitored via rapidFLIM. The large beads with a size of 3.42 µm are labeled with Nile Red showing a fluorescence lifetime of 3.3 ns. The smaller bead population (average diameter of 2.07 µm) contains the dye Dragon Green featuring a fluorescence lifetime of 4.0 ns. The movie was acquired with about 6 frames per second, corresponding to a pixel dwell time of 4 µs. The resulting noisy FastFLIM video (top) with low FLIM contrast has been improved by applying the pattern matching analysis, as shown in the bottom video.
For each species, a lifetime pattern was generated (shown below: green curve = Dragon Green, red curve = Nile Red) and the recorded FLIM data was analyzed using these patterns, resulting in the second video with improved lifetime contrast.

Sample Details:
- Nile Red: Lifetime 3.3 ns, bead size 3.42 µm
- Dragon Green: Lifetime 4.0 ns, bead size 2.07 µm
- LSM Upgrade Kit on Olympus FluoView FV1000
- Excitation: 485 nm, 20 MHz
- TCSPC unit: Time Harp 260 NANO
- Detector: PMA Hybrid, > 500 nm
- Image size: 128 x 128 px
- Scan speed: 4 µs / px ~ 6 FPS
- Max. 300 photons per pixel
- Analysis: SymPhoTime 64
Pattern matching analysis allows distinguishing auto fluorescence from specific fluorophores
Pattern matching analysis is implemented within the SymPhoTime 64 software as a very user friendly tool. This analysis method provides a fast way to obtain a first insight into overall lifetime distributions patterns without having to perform a deconvolution fit.
Invisible ink is a common security technology and authentication feature used for example to secure banknotes or passports. FLIM imaging can reveal this invisible ink and allows identifying its components due to their fluorescence lifetime.

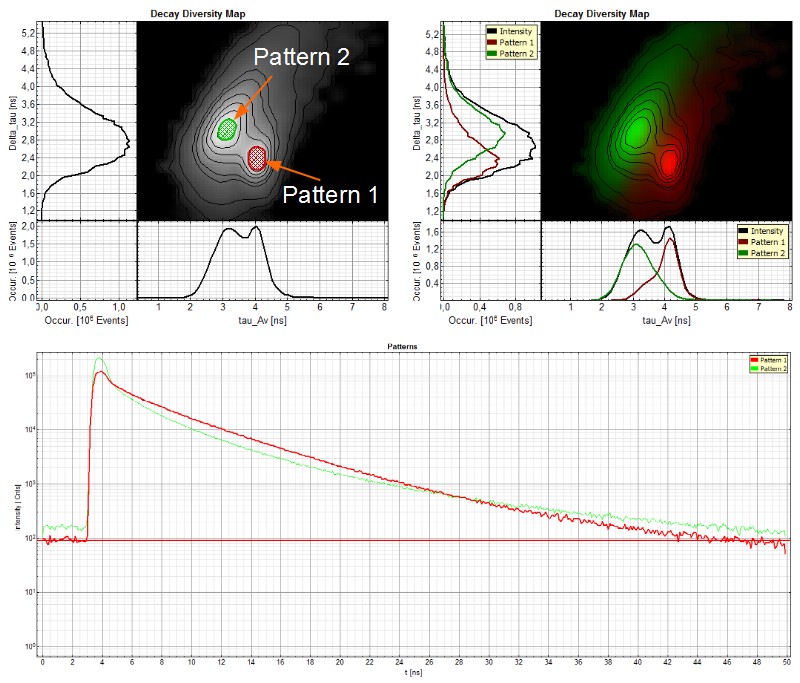
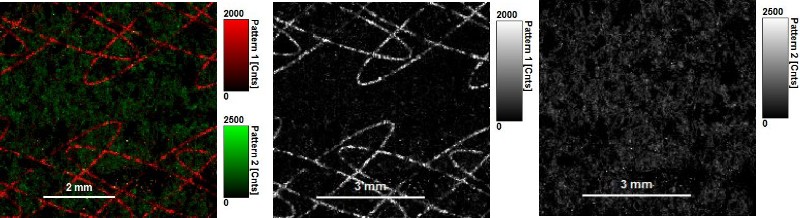
In the first example an invisible ink composition was used to generate a guilloché pattern on paper. The ink component with a longer lifetime (red) can be separated from the paper auto fluorescence, having a shorter lifetime (green), by selecting two regions of interest in the decay diversity map (arrows and shaded area). By applying a pattern matching algorithm, the spatial distribution of these two patterns can thus be nicely separated and visualized.

 Note that the invisible ink used here is a mixture of two dyes. The lifetime contribution from both dyes can be evaluated by applying a further fitting step.
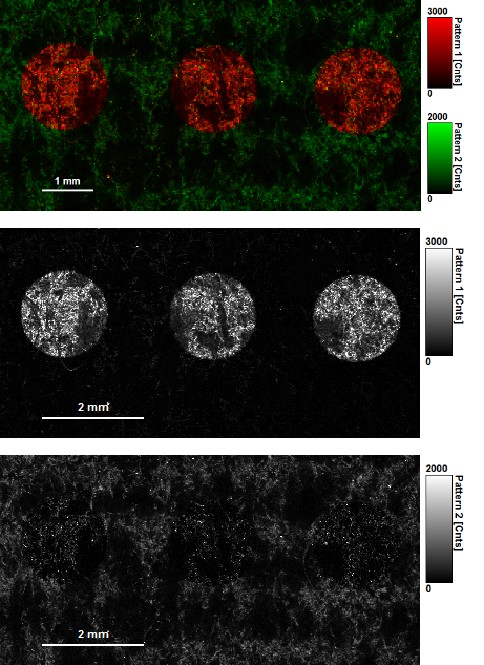
In the second example, the paper and printing quality were evaluated. Round, spot-like patterns of invisible ink were printed onto the paper. As in the first example, the ink lifetime pattern can be easily separated from the auto fluorescence of the paper (as shown in the different populations in the Decay Diversity Map). Not all dots showed a uniform dye distribution with well-defined spot shape.
The ink pattern representing the overall fluorescence decay of the mixture can be further analyzed by fitting it to an exponential decay model. This analysis allows to identify the individual components of the ink mixture.

- MicroTime 100
- Excitation: 485 nm, 40 MHz
- Emission: 495 nm - 595 nm
- Detection: PMA Hybrid
- Analysis: SymPhoTime 64
Samples courtesy of U-NICA Group, Switzerland.
Pattern matching analysis as a tool for identifying wood fibers according to their auto fluorescence lifetime
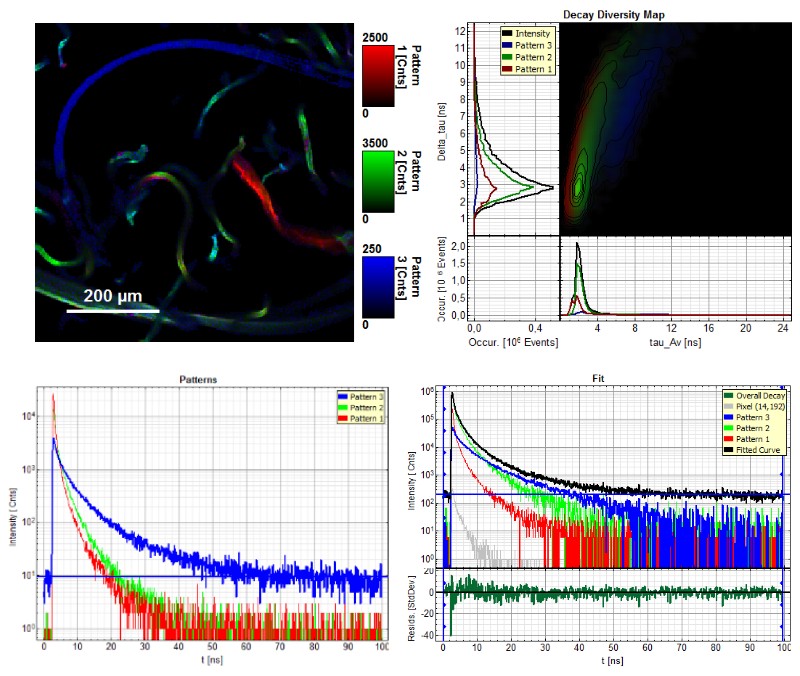
Distinguishing different wood fiber types can be a difficult process. Patter matching is a very powerful and user friendly method for identifying wood fiber types based on their fluorescence lifetime. Therefore, individual auto fluorescence lifetime patterns of the different wood fibers were determined beforehand to visualize areas with different lifetimes in the FLIM image. The pattern matching algorithm searches within the image for similar lifetime patterns, which results in the possibility to differentiate between various wood fiber types within a diverse sample.

The FLIM image (top left) shows the results of a pattern matching FLIM analysis of a fiber blend consisting of pine wood tmp fibers (red), delignified beech wood fibres (green) and thermoplastic synthetic fibres (blue). The image is color-coded according to the three predefined patterns. Top right: Decay diversity map where average lifetimes are plotted against Dt, the lifetime variance indicating the mono-/multi-exponentiality of the fluorescence decay The three lifetime populations (patterns) are displayed according to the color-code. Bottom left: Fluorescence lifetime patterns of the three different types of fibers used in the pattern matching analysis. Bottom right: Fitting of the overall fluorescence decay using the three lifetime patterns
- MicroTime 100
- Excitation: 375 nm, 10 MHz
- Emission: 450 - 560 nm
- Analysis: SymPhoTime 64
Sample courtesy of Henry Bartsch, IHD Dresden, Germany.
A pattern matching approach for tissue analysis using cell autofluorescence
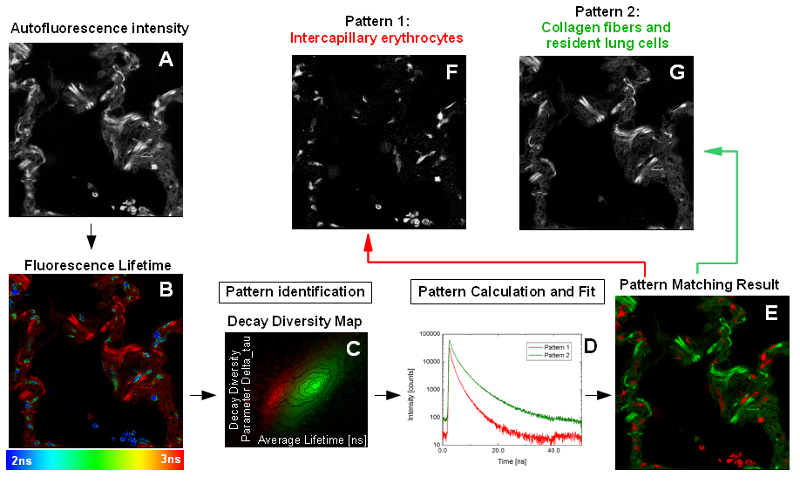
Specific autofluorescence properties of different cell types can be used to identify certain components of a tissue as shown in the following example. Most of the lung is composed of thin-walled alveoli. The alveoli are composed of a single layer of squamous epithelium. Collagen fibers form the backbone of the alveoli (like a building block). Between the alveoli there is a thin layer of connective tissue and numerous capillaries that are also lined with simple squamous epithelium. Within the autofluorescence intensity image of the alveolar compartment of peripheral human lung tissue, no discrimination between these different structures was possible (Fig. A). However, the capillary erythrocytes are clearly distinguishable from the lung tissue due to their shorter fluorescence lifetime in the Fast FLIM image (Fig. B).

The difference between collagen fibers (and resident lung cells) on the one hand and intracapillary erythrocytes on the other hand in respect to the fluorescence lifetime can be visualized by pattern matching. In the decay diversity map (Fig. C), the frequency of pixels with a certain average (= fast FLIM) lifetime and delta_tau, a parameter for the multi-exponentiality of the fluorescence decay, are plotted. The decay “fingerprints” of the individual tissue components are saved as “patterns”. By pattern matching, the intensities of the defined patterns are determined in each image pixel (Fig. D). In the pattern image (Fig. E), two distinct features are visible that differ in the average lifetime (as already seen in the FLIM image). Collagen fibers and lung cells with a longer lifetime (corresponding to pattern 2) cannot be separated, but erythrocytes (pattern 1) are clearly distinguishable from the other tissue components (Fig. F and G). Nevertheless, the fluorescence of each kind of pixels (= tissue) is multi-exponential due to the fact that in biological samples often numerous components like background and autofluorescence are summed up in the fluorescence decay. Therefore, and due to the low photon statistics, a standard multi-exponential fitting approach would not succeed in separating the different species within the lung tissue. The pattern matching approach fitting each component into every pixel is much more efficient and quite feasible when different components with distinct lifetime features need to be identified and separated.
- Zeiss LSM780 with LSM Upgrade Kit
- Excitation: 470 nm, 20 MHz repetition rate
- Emission: > 500 nm
Data courtesy of Andreas Hocke, Charité Berlin, Germany
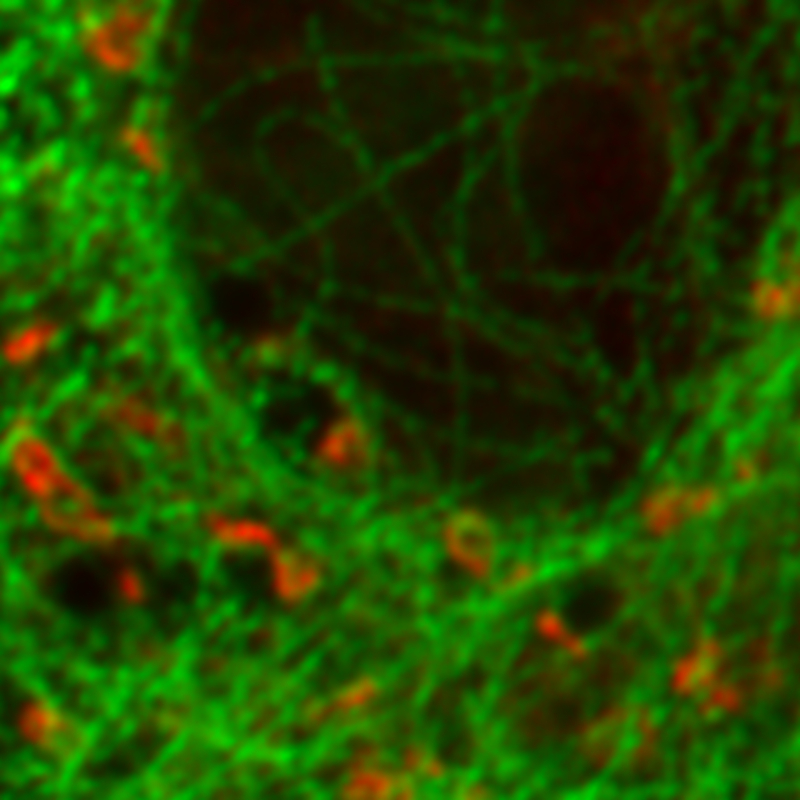
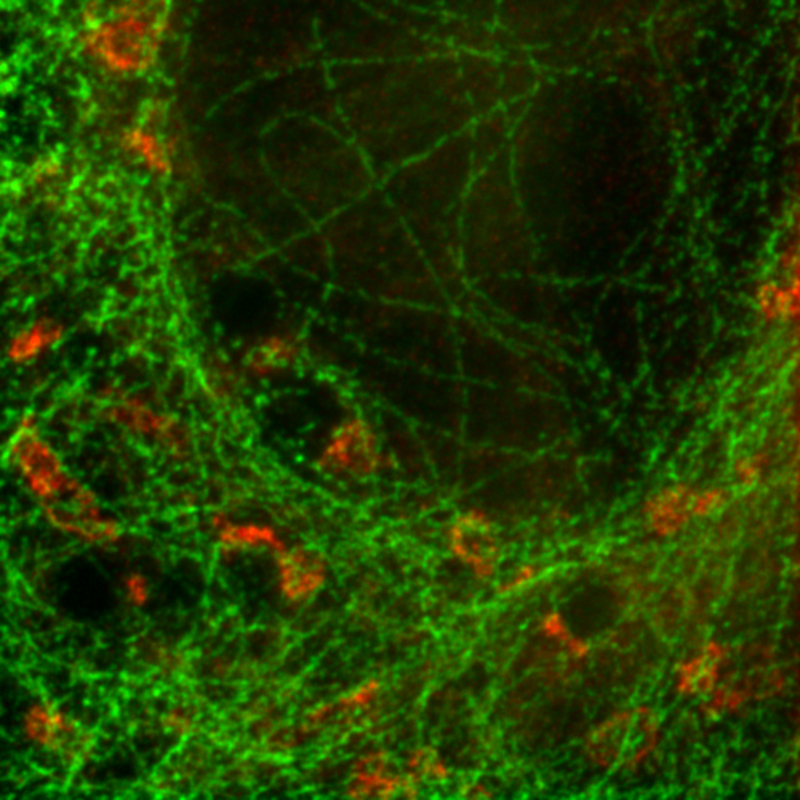
Separating two species with pattern matching analysis in a STED experiment
 and giantin with Atto647N")
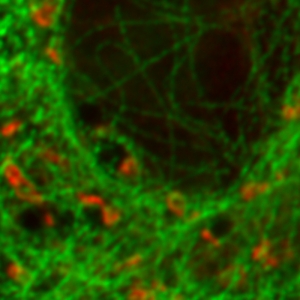
Two fluorescent species in STED can be distinguished by pulsed interleaved excititation (PIE) with two slightly shifted wavelengths and detection of the fluorescence in two spectral bands. Fluorescence pattern matching was used to identify the contributions of each fluorophore. The example shows part of a U2OS cell labeled for tubulin with Abberior STAR 635p (green) and giantin with Atto647N (red) utilizing a single STED laser wavelength and excitation with two different diode lasers at 640 nm and 660 nm.
- MicroTime 200 STED
- Excitation 640 nm and 660 nm
- Depletion: 765 nm
Sample courtesy of Markus Sauer, University of Würzburg, Germany