Life Science
Scanning Fluorescence Correlation Spectroscopy (sFCS) NEW
A variant of Fluorescence Correlation Spectroscopy (FCS), where the observation volume is scanned over the sample
Scanning Fluorescence Correlation Spectroscopy (sFCS) represents a variant of Fluorescence Correlation Spectroscopy (FCS). In both methods, the temporal fluctuation of fluorescence intensity is investigated by a correlation analysis. However, instead of recording data from a fixed spot, with scanning FCS the observation volume is moved with respect to the sample. The repeated sampling of one part of the sample ensures less photobleaching of the fluorophores as well as an increased statistical accuracy. Thus, scanning FCS facilitates the examination of the dynamic behavior as well as concentrations in live cell applications.
 Contact us
 Studying fluctuations in fluorescence intensity by means of correlation analysis offers insights into the photophysics of fluorophores as well as into their diffusion behavior and absolute concentration. From this data, other important parameters can be derived, such as particle size and shape or viscosity of the environment.
In conventional Fluorescence Correlation Spectroscopy (FCS), the temporal changes in emission intensity are recorded from a small, fixed observation volume. The strength and duration of these changes are then quantified by a temporal auto-correlation. As result of this analysis, the number of emitting particles in the observation volume and their average diffusion time are quantified.
In scanning FCS (sFCS), the observation volume is scanned repeatedly in a defined manner over the sample. Thus, a spatial component is added to the temporal correlation analysis.
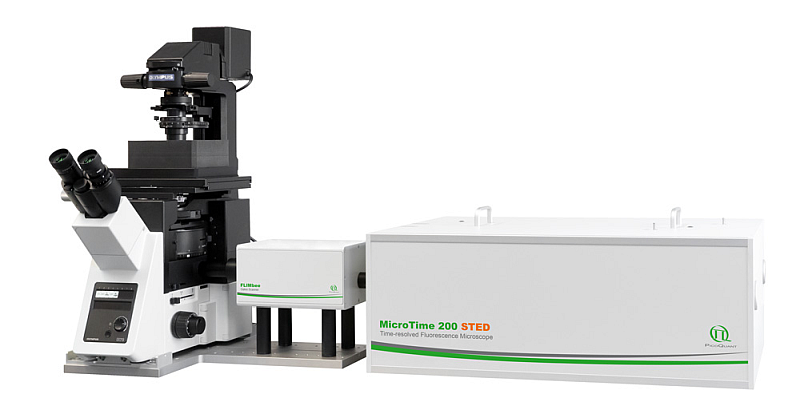
Thanks to its design, PicoQuant’s MicroTime 200 microscopy platform achieves outstanding single molecule sensitivity, making it ideal for all types of FCS measurements. When equipped with the FLIMbee galvo scanner, the MicroTime 200 is capable of fast linear scan motions with constant speeds. As high linearity along with high, constant velocity are key factors in analyzing sFCS data, the FLIMbee galvo scanner is ideally suited for this method.
Advantages of sFCS
Combining temporal fluorescence correlation analysis with fast line scanning provides several advantages:
- Observe a larger ensemble of species. Monitoring a larger ensemble thanks to the moving observation volume leads to improved statistics. This also facilitates investigations of species with slower diffusion times than usually investigated with conventional FCS, which is particularly relevant for studying protein dynamics in various environments such as living cells or membranes.
- Reduce photobleaching. Scanning the observation volume across the sample leads to decreased residence times of the observed fluorophores in the observation volume ensuring less photobleaching and phototoxicity compared to conventional FCS.
- Combine with Stimulated Emission Depletion (STED). Our sFCS approach can be combined with the STED super-resolution option of our MicroTime 200 platform. Performing STED-sFCS measurements beyond the diffraction limit allows for the investigation of diffusion properties of fluorophores in membranes, similar to spot variation FCS.
- Get the calibration for free: sFCS provides not only temporal but also long range spatial correlations. The spot size is directly extracted from the collected data and there is no need for additional calibration measurements. The simplified experimental approach thereby facilitates absolute diffusion and concentration measurements.
- Include lifetime information. A novel key factor in our approach is the combination of sFCS data with time-resolved data acquisition. The fluorescence lifetime provides an additional contrast, enabling e.g., the unmixing of multiple luminescent species in a sample. In addition, advanced excitation schemes such as Pulsed Interleaved Excitation (PIE) are available for multi-species approaches.
PicoQuant's sFCS solution
PicoQuant aims to make this novel approach of time-resolved sFCS accessible to a wider audience and offers the following:
.") Data acquisition. A new line scanning mode for sFCS using the fast x-axis of the FLIMbee scanner is introduced in the SymPhoTime 64 software for the MicroTime 200. This enables the collection of time-resolved sFCS data using any MicroTime 200 equipped with a FLIMbee scanner.
Data acquisition. A new line scanning mode for sFCS using the fast x-axis of the FLIMbee scanner is introduced in the SymPhoTime 64 software for the MicroTime 200. This enables the collection of time-resolved sFCS data using any MicroTime 200 equipped with a FLIMbee scanner.- Data analysis. The acquired data can be analyzed using external third-party software options that are available free of charge. In order to also gain access to the fluorescence lifetime information in sFCS analysis, PicoQuant offers a ready-to-use Matlab code developed in collaboration with Jörg Enderlein (Georg August University Göttingen). This code will be available as open source.
PicoQuant offers the following sFCS solution for users of the Luminosa and MicroTime 200
PicoQuant aims to make this novel approach of time-resolved sFCS accessible to a wider audience and offers the following:
- Data acquisition. A new line scanning mode for sFCS using the fast x-axis of the FLIMbee scanner is introduced in the software for Luminosa and MicroTime 200 microscopes. This enables the collection of time-resolved sFCS data using any PicoQuant microscope equipped with a FLIMbee scanner.
- Data analysis. The acquired data can be analyzed using external third-party software options that are available free of charge. In order to also gain access to the fluorescence lifetime information in sFCS analysis, PicoQuant offers a ready-to-use Matlab code developed in collaboration with Jörg Enderlein (Georg August University Göttingen). This code will be available as open source.
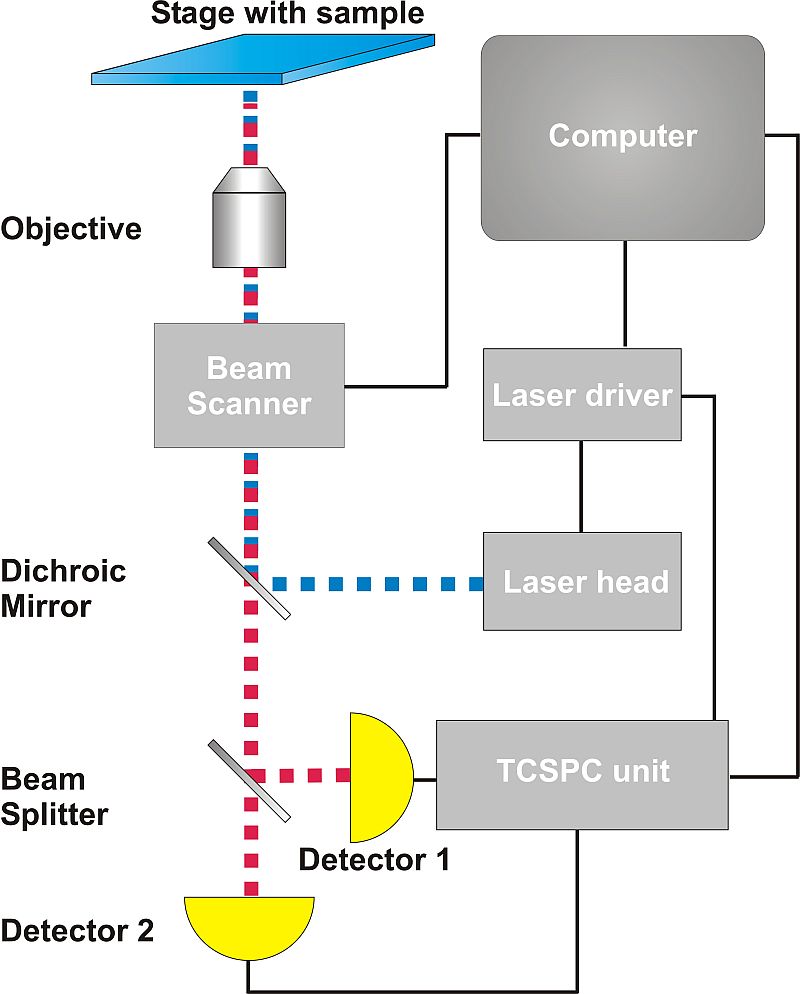
 Besides the MicroTime 200 equipped with the FLIMbee add-on, PicoQuant also offers some of the necessary parts to built your own sFCS set-up from scratch:
- Excitation source with short pulses and high repetition rate
- Laser drivers: PDL 800-D, PDL 828
- Laser heads: LDH-I Series, LDH Series, LDH-FA Series
- Photon Counting Detector
- TCSPC Electronics
- Scanning device
- Galvo scanner
- Analysis software
- Confocal optics
Scanning FCS can be used for a wide variety of applications, including:
- photodynamic investigations in model and cell membranes
- study of membrane organization including lipid domains or rafts
- distribution and dynamics of membrane proteins
- molecule oligomerization in the interior of live cells
- biological molecular mobility, effect on cell physiology
- transient binding events in living cells
Scanning Fluorescence Correlation Spectroscopy (sFCS) can improve event statistics
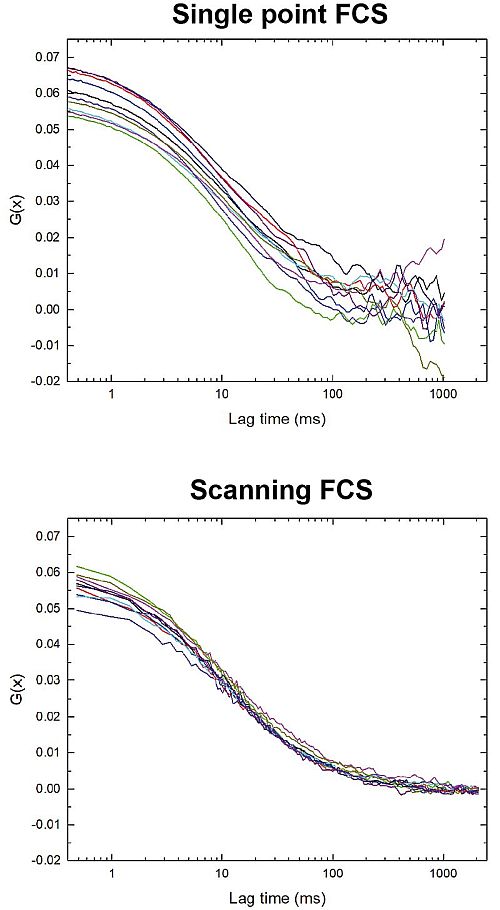
 In this example, the diffusion of lipids labeled with KK114-DPPE (0.2 µg / ml) in in a supported lipid bilayer made of DOPC (1 mg / ml) was investigated both with conventional FCS and sFCS. For the conventional measurement (upper panel), data was acquired with 10 separate point measurements, each with a duration of 12 s. An average diffusion time of 10.7 +/- 1.2 ms was obtained.
In the scanning FCS experiment, 10 individual line measurements were carried out with an acquisition time of 6 s per line. Each line measurement comprised 25000 lines with 100 pixels / line, and 2.4 µs dwell time per pixel. Total acquisition time was only 60 s in this case and an average diffusion time of 10.5 +/- 0.76 ms was determined.
Here, sFCS results in a more accurate measurement (i.e. smaller statistical error) with a significantly shorter acquisition time. Additionally, the moving observation volume increases the probability of detecting slow events, which is ideal for studying slowly diffusing species.
Sample courtesy of Prof. Ch. Eggeling
Temporal and Spatial Correlation via linescan in x using PicoQuant’s FLIMbee galvo scanner
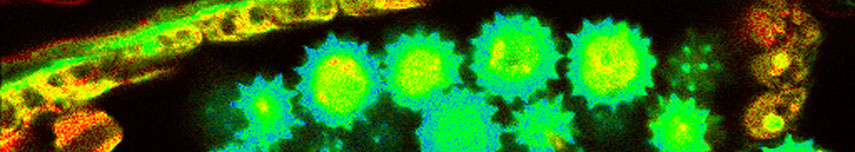
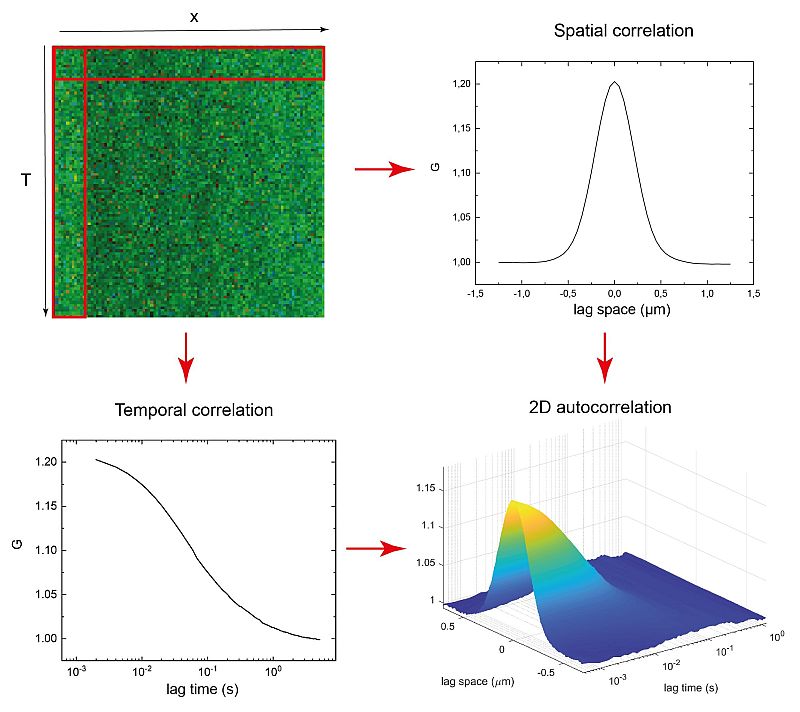
 Due to its scanning nature, sFCS provides not only temporal but also long range spatial correlations. In the example shown here, a map of intensity fluctuations observed along a defined line (top left) was recorded from a DOPC (1 mg / ml) supported lipid bilayer containing DPPE proteins labeled with STAR RED l0.2 µg / ml).
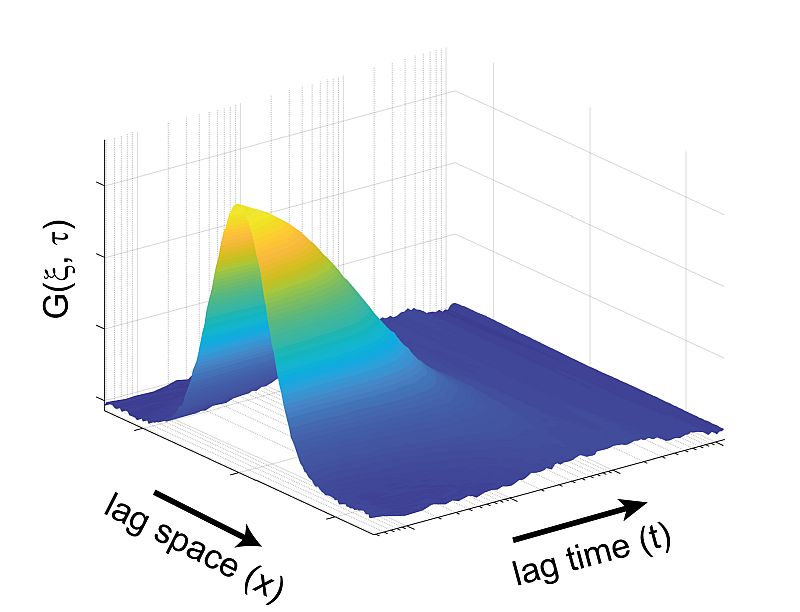
From this acquired data, one can generate either spatial (top right, with lag time = 0) or temporal (bottom left, with lag space = 0) correlation curves based on the corresponding single axis. The data set is used to perform a 2D correlation, as shown in the bottom right.
The sFCS data provides a simple, quantitative and sensitive method for, e.g., studying protein-membrane interactions. Furthermore, the size of the observation area can be directly extracted from the collected data with no need for additional calibration.
Sample courtesy of Prof. Ch. Eggeling
MatLab code used for analysis courtesy of Prof. J. Enderlein (Georg August University Göttingen)
Reference: Ries et al. Biophys. J. 96, p. 1999 (2009)
Combine PicoQuant’s sFCS approach with Stimulated Emission Depletion (STED) microscopy
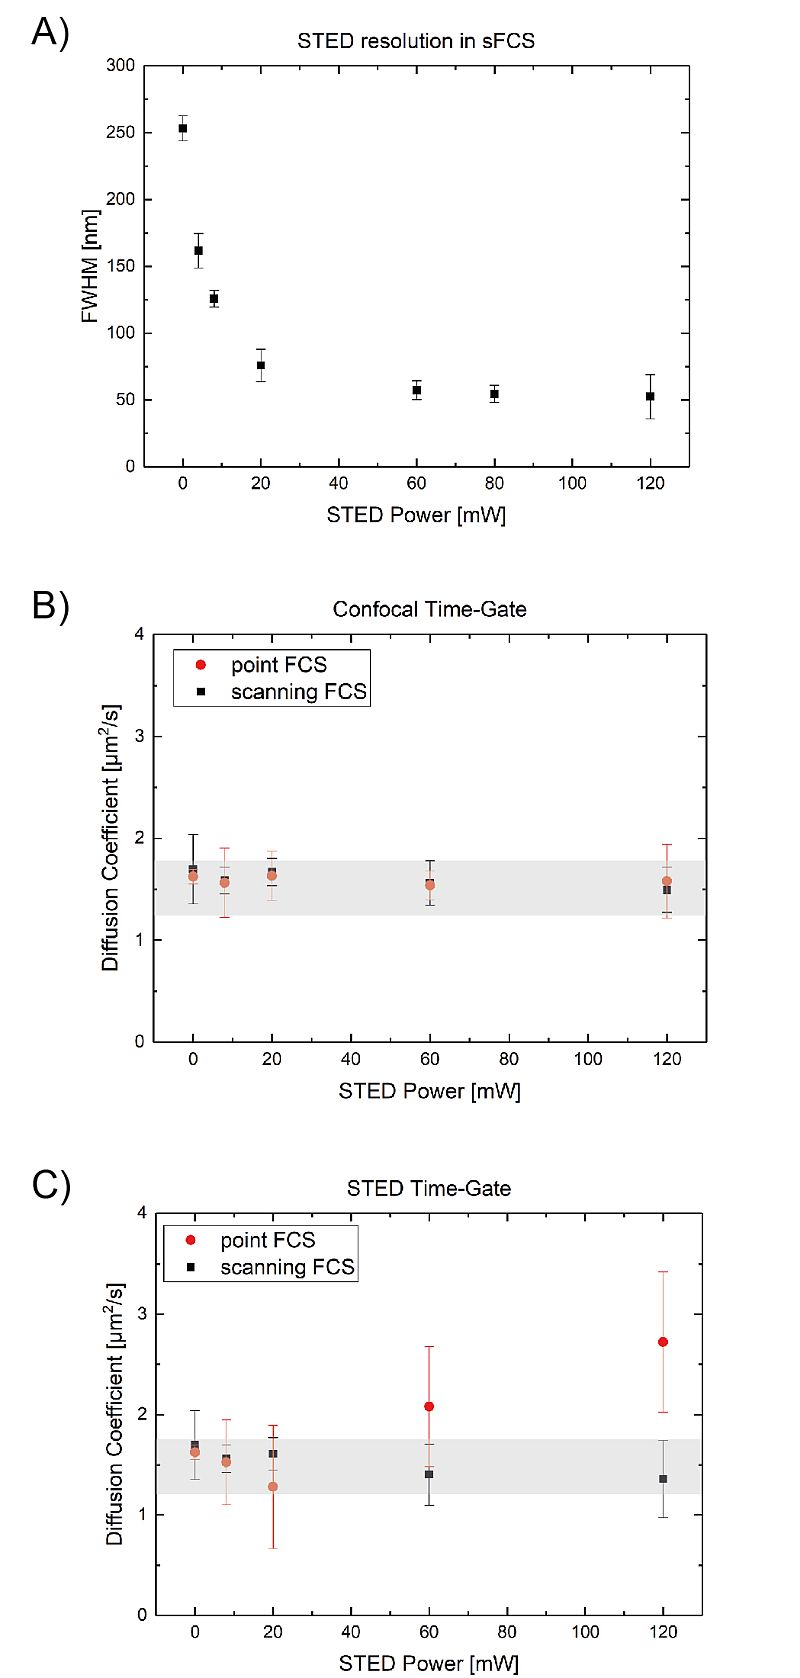
 PicoQuant’s sFCS approach can be combined with, for example, Stimulated Emission Depletion (STED) to perform correlation spectroscopy beyond the diffraction limit. This type of experiment is comparable to spot size variation FCS, the main difference being that the excitation volume size is controlled by the STED laser power (A). The plotted observation area sizes were extracted form the spatial correlation.
Using a variety of observation volumes beyond the diffraction limit helps in investigating diffusion heterogenity over time and space in, for example, a cell membrane. When combined with Pulsed Interleaved Excitation (PIE), it is possible to record data with confocal and STED resolution quasi-simultaneously (for more information on PIE-STED-FCS: see M. Koenig et al. Proc. SPIE 9712, 97120T (2016)). This approach helps in identifying STED based artifacts.
Since the observation spot is scanned over the sample, photobleaching and phototoxicity are significantly lower when using sFCS compared to conventional FCS. This effect can be seen when looking at the diffusion coefficient of DPPE labeled with KK114 freely diffusing in a DOPC supported lipid bilayer. In this example, PIE-STED was use to acquire FCS or sFCS data with confocal and STED resolution quasi-simultaneously.
Under confocal conditions (confocal time-gate, B), the observed diffusion times with conventional FCS and sFCS are nearly identical. While the situation changes when STED conditions are used (STED time gate, C): At high STED powers, the diffusion times detected with conventional FCS apparently are much faster. This increase is due to photobleaching of label emission. The protein is still moving at the same velocity as before but can no longer detected. This effect is strongly mitigated in the sFCS measurements.
Latest 10 publications related to FCS
The following list is an extract of 10 recent publications from our bibliography that either bear reference or are releated to this application and our products in some way. Do you miss your publication? If yes, we will be happy to include it in our bibliography. Please send an e-mail to info@picoquant.com containing the appropriate citation. Thank you very much in advance for your kind co-operation.