Life Science
Single Molecule Detection (SMD)
Gaining insights into the photophysics of emitters by studying them individually
Many systems are either dynamically or stationary inhomogeneous and the inhomogeneities, especially dynamic inhomogeneities, are the key to understand their interactions and functions. Ensemble measurements naturally can only yield the mean value of the ensemble. Single-molecule trajectories on the other hand are direct records of the fluctuation that contain detailed dynamical and statistical information. Since trajectories may vary for different members of the ensemble the average trajectory contains less information, the ensemble might not even show fluctuations at all as they could be averaged out during the timespan of the experiment.
Single molecule detection techniques are also essential in overcoming the diffraction limit in microscopy and have been honored with the 2014 Nobel prize in chemistry. PicoQuant has a long history of supporting the single molecule community both with state of the art instrumentation as well as through hosting single molecule events around the world for many years.
 Contact us
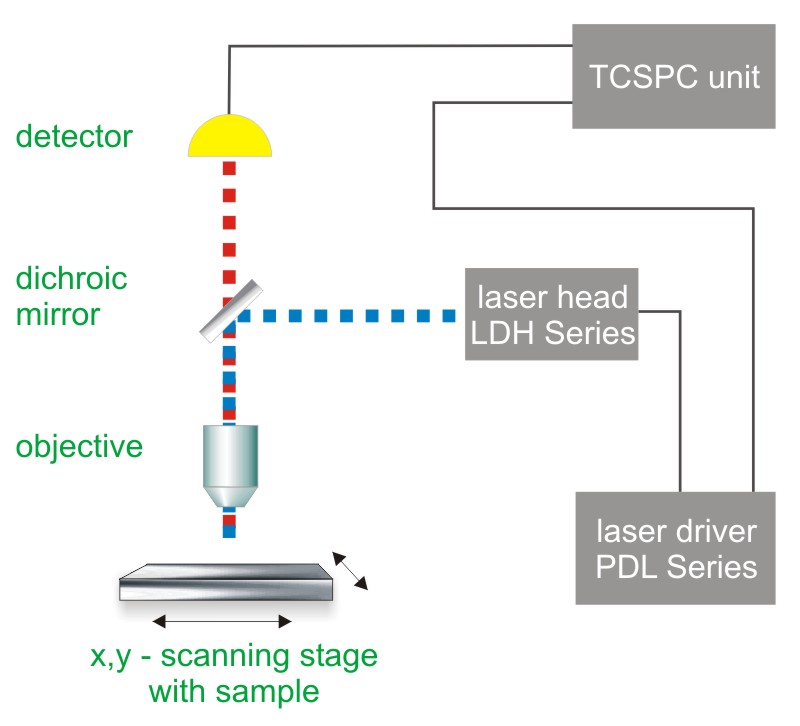
 Single molecule detection requires a highly sensitive confocal microscope. For a simple set-up, a single laser and a single photon counting detector is needed. For more sophisticated experiments, several detectors as well as a highly stable piezo scanning system are used. As single molecule trajectories are usually studied as a function of time, the data acquisition is very often performed using Time-Correlated Single Photon Counting (TCSPC).
Consequently, the essential components of a single molecule detection set-up are:
- pulsed excitation source
- single photon sensitive detector
- dichroic mirror (to separate fluorescence signal from excitation light)
- objective (to focus the excitation light into the sample and collect fluorescence signal)
- TCSPC unit to measure the time between excitation and fluorescence emission
The following PicoQuant microscopy products can be used tp perform single molecule detection (SMD)
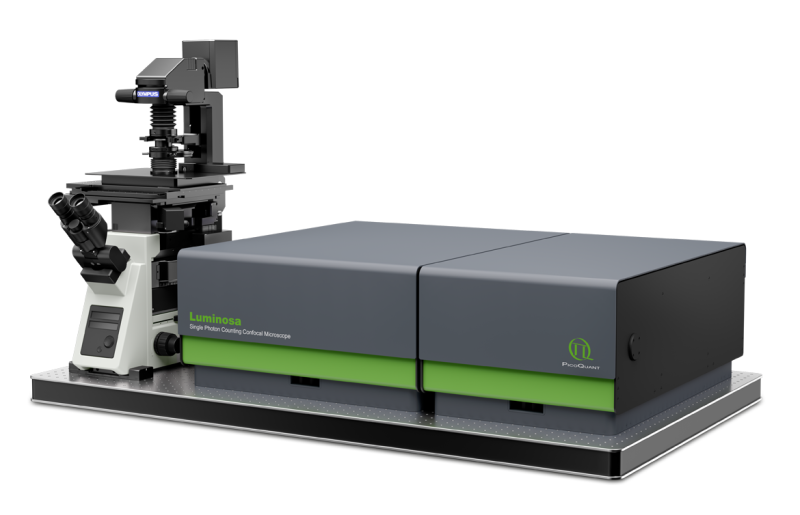
 Luminosa
Single Photon Counting Confocal Microscope
Luminosa combines state-of-the-art hardware with cutting edge software to deliver highest quality data while simplifying daily operation. The software includes context-based workflows for FLIM, FRET, and FCS, which allow the users to focus on their samples. Tight integration of hardware and software enable automated routines, e.g., for auto-alignment or laser power calibration, which increase ease of use as well as reproducibility of experiments. Still, an open mode of operation is available for full access to every optomechanical component via software.
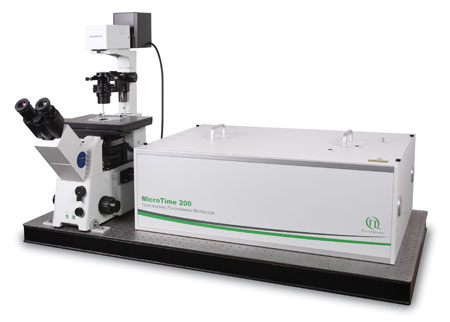
 MicroTime 200
Modular, time-resolved confocal fluorescence microscopy platform
The MicroTime 200 time-resolved fluorescence microscope system is a powerful instrument with single molecule sensitivity, capable of Fluorecence Corelation Spectroscopy and its daughter techniques as well as Fluorescence Lifetime Imaging (FLIM) and Stimulated Emission Depletion (STED). It contains the complete optics and electronics for recording virtually all aspects of the fluorescence dynamics of microscopic samples or femtoliter volumes. The instrument gains its exceptional sensitivity and flexibility in combination with unprecedented ease-of-use from a unique fusion of miniaturized and highly sophisticated state-of-the-art technologies. Although, these technologies enable to run an instrument of comparable complexity and power without having to spend more time on instrument maintenance than on original scientific content, the MicroTime 200 remains an open platform that allows the advanced scientist to easily built upon the open character of the instrument in order to realize highly customized applications
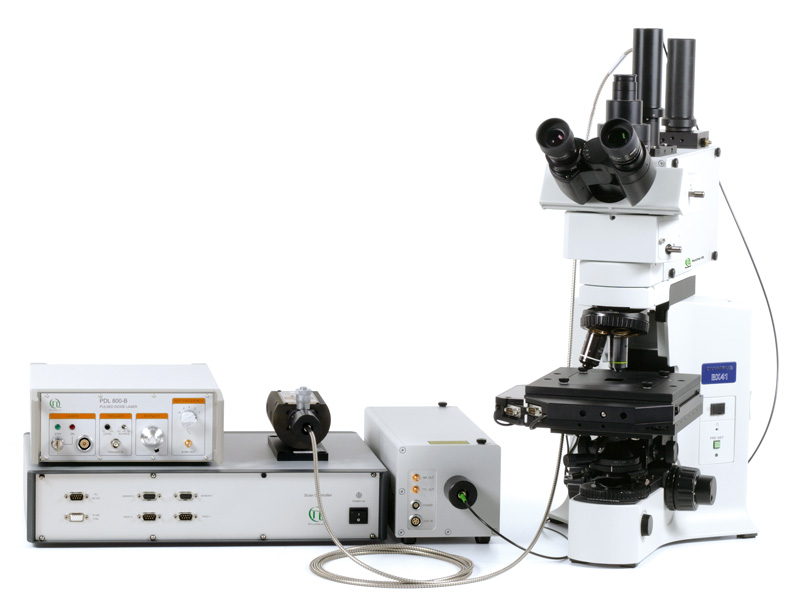
 MicroTime 100
Upright time-resolved confocal microscope
The upright time-resolved microscope MicroTime 100 contains the complete optics and electronics for recording F(C)CS or FLCS data as well as fluorescence lifetime images and decays in small volumes by means of Time-Correlated Single Photon Counting (TCSPC) with single molecule sensitivity. The system is based on a conventional upright microscope body that permist easy access to a wide range of sample shapes and sizes.
The following core components are needed to build a system capable of single molecule detection, which are (partly) available from PicoQuant:
- Laser drivers
- Laser or LED heads
- Photon Counting Detector
- TCSPC Electronics
- Analysis software
- Scanning device
- Galvo- or Piezo-Scanner
- Confocal optics
The following videos where recorded during the 20th International Workshop on “Single Molecule Spectroscopy and Ultrasensitive Analysis in the Life Sciences”, held in Berlin in September 2014. In the videos, three renowned researches in the field of single molecule detection, including Nobel Price winner W.E. Moerner, talk about their personal views on the past, present, and future of this field.
Single Molecule Spectroscopy reveals the structural architecture of Prothrombin in solution
 Prothrombin is a plasma protein that circulates at a concentration of 0.1 mg/ml. It is composed of 622 aa, organized in 4 domains and 3 linkers. Crystallization of prothrombin has succeeded only recently and required deletion of the Gla domain or significant portions of the flexible Lnk2. An unexpected molecular picture has emerged from these structures: prothrombin is organized as two rigid ends, the N-terminal Gla domain/kringle-1 pair and the C-terminal kringle-2/protease domain pair, capable of different relative arrangements mediated by Lnk2. Here we apply single molecule Förster resonance energy transfer (smFRET) to investigate the structural architecture and dynamics of prothrombin in solution.
We record the fluorescence of molecules freely diffusing through a femtoliter observation volume defined by a focused laser beam and confocal optics. Our experiments are carried out with pulsed interleaved excitation (PIE), which reports the status of both donor and acceptor fluorophores by sorting molecules on the basis of relative donor:acceptor stoichiometry (S) and apparent FRET efficiency (E).
The conformation of full-length prothrombin in solution was investigated with FRET couples positioned in the N-terminal Gla domain/kringle-1 pair (34/101), the C-terminal kringle-2/protease domain pair (210/478), or across the flexible Lnk2 (101/478 and 120/478). Only the FRET couples positioned across Lnk2 report two distinct populations of interprobe distances. The flexibility of Lnk2 produces relative arrangements of the rigid ends of the zymogen in solution not captured by our recent X-ray structural studies. Using information from existing crystal structures of prothrombin and the interprobe distances measured by smFRET we built a model of the closed conformation of prothrombin in solution that shows the intramolecular collapse of kringle-1 onto the protease domain mediated by the Y93-W547.
 and obseverd FRET efficiencies (b and c)") Prothrombin exists in equilibrium between two alternative conformations, open and closed, that differ 50 Å in length. The closed conformation predominates (70%) and features an unanticipated intramolecular collapse of Y93 in kringle-1 onto W547 in the protease domain that obliterates access to the active site.
Prothrombin exists in equilibrium between two alternative conformations, open and closed, that differ 50 Å in length. The closed conformation predominates (70%) and features an unanticipated intramolecular collapse of Y93 in kringle-1 onto W547 in the protease domain that obliterates access to the active site.
Set-up:
- MicroTime 200
- Excitation: 532 nm and 638 nm, 40 MHz repetition rate, PIE
- Emission: dual channel detection with 550 - 590 nm (donor) and 655 – 725 nm (acceptor)
- Analysis: SymPhoTime 64
References: Pozzi N et al., J Biol Chem. (2016), 291, 18107-18116; Pozzi N et al., J Biol Chem. (2016) 291, 6071-6082
Using single molecule sensitive PIE-FRET to monitor Mg2+ driven RNA folding of a tetraloop receptor
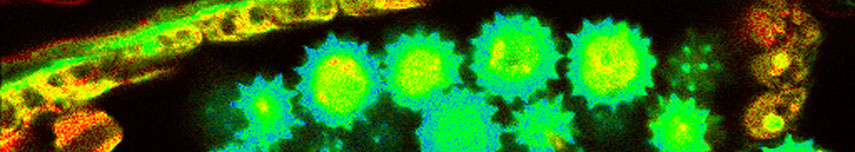
The analyzed construct contains an important RNA folding motif consisting of a tetraloop receptor labeld with CY5 as acceptor fluorophore and a flexible tetraloop fused to the donor CY3 (Fig. A). The RNA folding is Mg2+ driven and can be monitored by FRET as this construct could adopt two different conformations: an open state without any interaction between tetraloop and receptor and a closed state wherein due to the interaction between the two regions the donor and acceptor dye come into very close vicinity. This leads to FRET and a quenching of the donor fluorescence intensity and lifetime.
 Fig. B shows a plot of the FRET efficiency E versus the Photon stoichiometry S that clearly displays three subpopulations within the sample (for details of the analysis see S. Weiss, Biophys. J. 88 (2005) 2939). S is the ratio between the number of FRET photons and donor photons (nominator) and the number of all photons (denominator) and is calculated as:
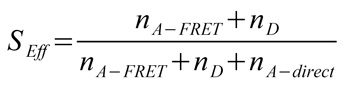
S is decreasing towards smaller numbers if the acceptor is present and can directly be excited via PIE. Thus, the population with a higher value of S and almost zero FRET efficiency corresponds to donor only labeled molecules. The other two populations have a similar photon stoichiometry but different FRET efficiencies.
For each sub-population the donor fluorescence lifetime was fitted by a 2-exponential decay model (Fig. C-E). The longer lifetime component was used to determine the FRET efficiency. The sub-population with the lower E corresponded to the open configuration whereas the molecules exhibiting a closed configuration and interaction between tetraloop and tetraloop receptor showed high FRET efficiency.
Set-up:
- MicroTime 200
- Excitation: 532 nm, 40 MHz repetition rate
- Emission: dual channel detection with 550 - 620 nm (donor) and 660 – 740 nm (acceptor)
- Analysis: SymPhoTime
In collaboration with J. Fiore and David Nesbitt, JILA, University of Colorado, Boulder, USA
Reference: J. Fiore et al., Biochem. (2009), 48, 02550-02558
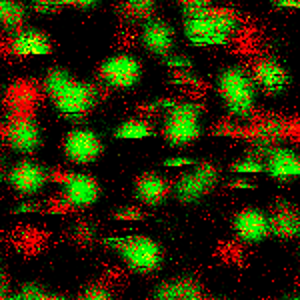
Recording a fluorescence lifetime image of single Cy5 molecules
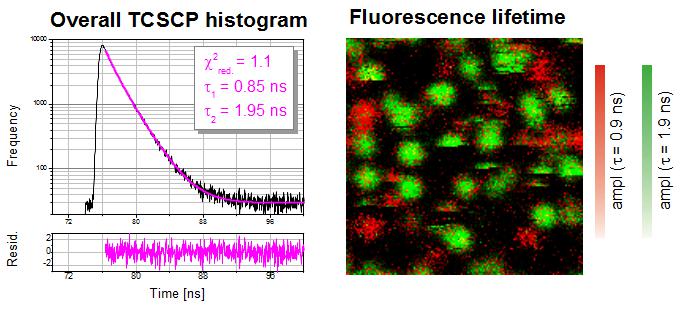
 This example shows a FLIM image of immobilized single Cy5 molecules on a glass coverslip. The overall TCSPC histogram using all recorded photons can be fitted with a double exponential decay indicating a spatial distribution of two different fluorescence "states". In the FLIM image the two types of emitters can then be separated and visualized based on their lifetimes. The two different states are most likely due to different molecular orientations, conformations or interactions of the Cy5 molcules with the glass surface.
Set-up:
- MicroTime 200
- Excitation: 638 nm
- Analysis: SymPhoTime
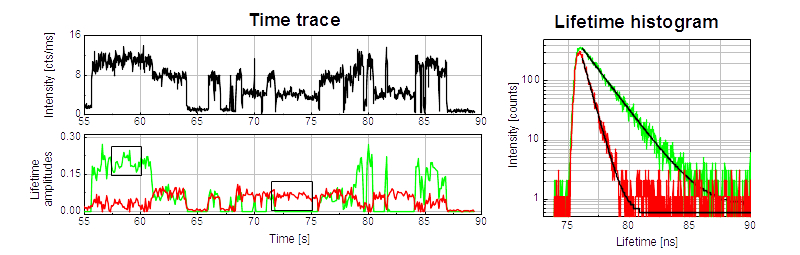
Observing the blinking of single Cy5 molecules
Single molecules show intensity fluctuations due to transitions into different kinds of dark or dim states (triplet, non-absorbing/fluorescent conformations, nearby quenchers like oxygen, etc.). The example shows a fluorescence intensity time trace of an immobilized single Cy5 molecules on a glass coverslip. Transitions between three different states (bright, dim, dark) can clearly be identified. A further analysis of the the fluorescence lifetime trace using a double exponential decay model with fixed lifetimes (0.7 ns and 1.6 ns) shows that all bright states are dominated by the long lifetime component (green), wheras the dim states show mainly the shorter lifetime component (red). This is a clear indication for a competing non-radiative decay channel in the dim states which leads to a reduced fluorescence intensity and lifetime.

Set-up:
- MicroTime 200
- Excitation: 638 nm
- Analysis: SymPhoTime
Single molecule FRET (smFRET) enables investigation of phosphoglycerate kinase folding
Single-molecule FRET (smFRET) studies of phosphoglycerate kinase from yeast (yPGK) were performed at different concentrations of guanidine hydrochloride (GndHCl) to investigate protein folding.
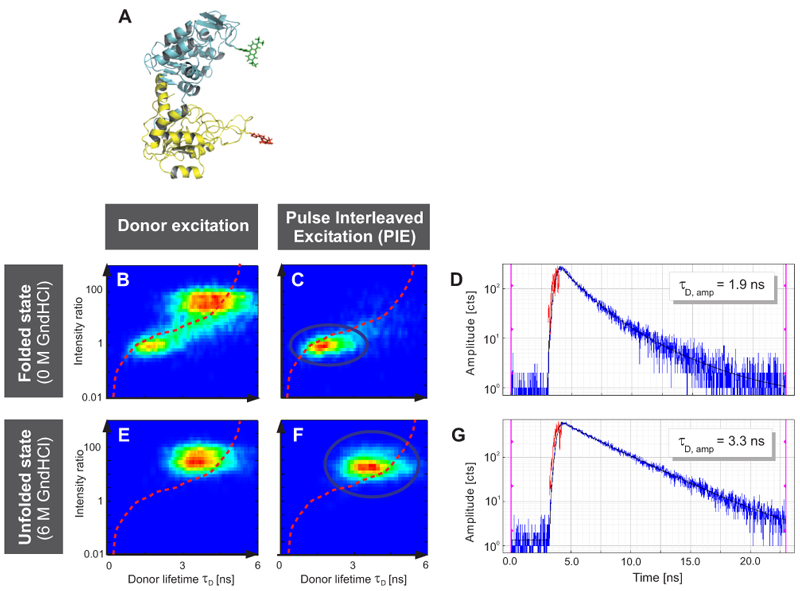
 Fig. A displays the three-dimensional structure of yPGK and the fluorophores Alexa 488 and Alexa 647 attached to position 135 in the N-terminal (cyan) and position 209 in the C-terminal (yellow) domain, respectively. This FRET pair displays a Foerster radius R0 of 48.9 Å.
Interdomain distances of the native state and evolving unfolded states at increasing GndHCl concentrations were analyzed. The conformational characterization of native and unfolded states was performed by measuring FRET efficiencies for individual protein molecules at different GndHCl concentrations. The results of the Multiparameter Fluorescence Detection (MFD) with the depiction of the FRET indicator FD/FA versus the donor lifetime τD are shown (Fig. B, C, E and F). At 0 M GndHCl mainly the native population with high FRET was visible (Fig. B and C). The fitted donor fluorescence lifetime decreased to 1.9 ns (Fig. D). Without PIE, the donor only population was additionally observed (Fig. B).
An unfolded state population with no or low FRET and significantly expanded structure compared to the native state was detected at 6 MGndHCl concentration (Fig. E and F). Without PIE it is not possible to differentiate between this unfolded state and the donor only population (Fig. E). After exclusion of the donor only subpopulation via PIE (Fig. F), the unfolded protein configuration could be analyzed and a donor fluorescence lifetime of 3.3 ns was fitted (Fig. G).
The red lines indicate the theoretical prediction between the FRET indicator FD/FA and the donor lifetime τD in the presence of the acceptor2 taking into account distinct fluorescence quantum yields and detection efficiencies. Thus, the combination of PIE with MFD enabled for quantitative smFRET experiments.
Set-up:
- MicroTime 200
- Excitation: 470 nm and 640 nm, 20 MHz repetition rate, PIE
- Emission: dual channel detection with 500 - 540 nm (donor) and 655 – 725 nm (acceptor)
- Analysis: SymPhoTime
Data courtesy of by J. Fitter, Research Centre Jülich, Germany.
References:
[1] Rosenkranz T., Schlesinger R., Gabba M., Fitter J., ChemPhysChem 12, p.0704-0710 (2011)
[2] Sisamakis E., Valeri A., Kalinin S., Rothwelllow P. J., Seidel C. A. M., Methods in Enzymology, Vol.475, p.455-514 (2010)
Latest 10 publications related to Single Molecule Detection
The following list is an extract of 10 recent publications from our bibliography that either bear reference or are releated to this application and our products in some way. Do you miss your publication? If yes, we will be happy to include it in our bibliography. Please send an e-mail to info@picoquant.com containing the appropriate citation. Thank you very much in advance for your kind co-operation.