

Fluorescence Microscopes
MicroTime 200
A confocal microscopic platform with unique single molecule sensitivity
Highest data quality
- Proven track record for research applications requiring highest photon sensitivity like smFRET and FCS
- Best timing performance for many applications, ranging from dynamic FLIM of cellular environments to single emitter characterization via antibunching


Unmatched flexibility and openness
- Excitation and detection options ranging from deep UV to IR
- Open system architecture allows for many customisation options
- Open data format enables transparent acquisition, transport, and complementary analysis
An investment, which lasts many years
- High manufacturing quality guarantees long system lifetime
- Upgrade options to expand your system’s capabilities, keeping it state-of-the-art for many years
- Exceptional support: we tackle technical issues as well as scientific questions and offer user training

 Get in touch
- Why MicroTime 200
- Application examples
- Methods
- Hardware
- Add-ons
- Customization highlights
- Support
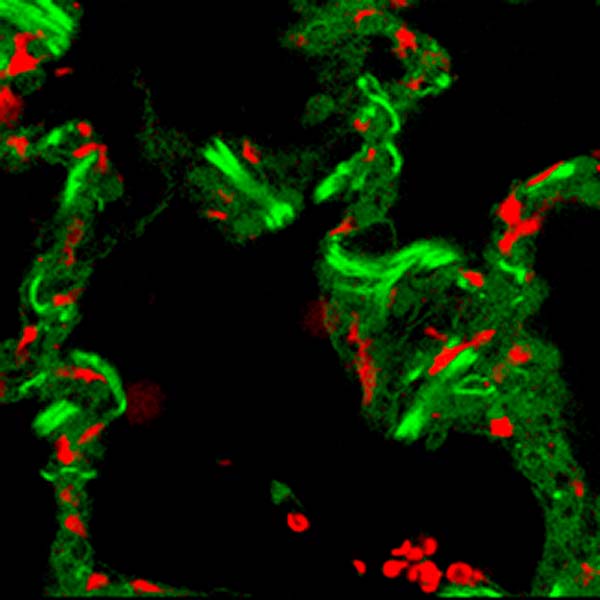
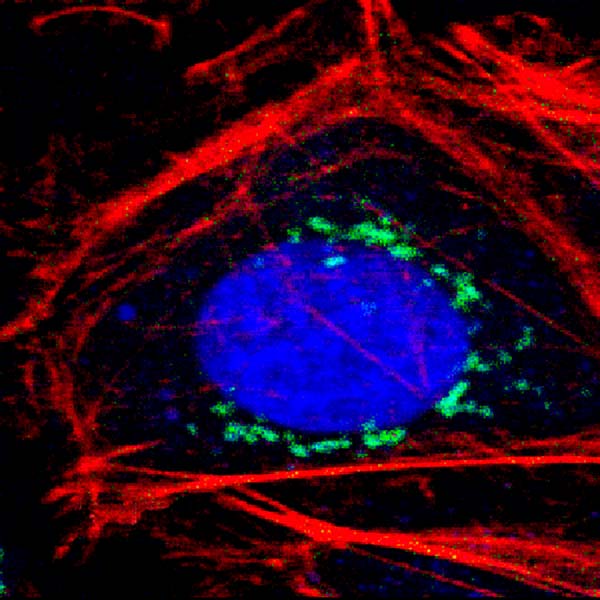
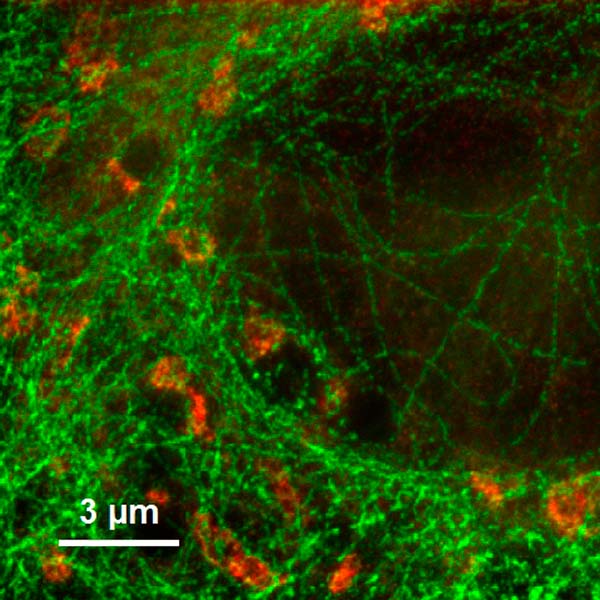
- Image Gallery
The MicroTime 200
A powerful and versatile time-resolved confocal microscopy platform
 Advancing cutting edge science in many fields requires single molecule studies such as the quantification of molecular dynamics, molecular properties, or interaction studies. Covering a broad range of research fields in life and materials science requires a flexible and sensitive instrument.
The MicroTime 200 microscopy platform is our answer to this challenge:
- Outstanding single molecule sensitivity and highest timing precision
- Modular design allows adapting each system to your individual needs
- Supports many techniques and applications used in life and materials science
- Manufactured to the highest quality standards; ensuring long system life (more than 20 years in many cases)
- Long-term availability of upgrade options keeps you on the cutting edge of research even long after initial purchase
Download MicroTime 200 brochure

MicroTime 200 demonstration
Get a closer look at the MicroTime 200 in action with our last MicroTime 200 Virtual Show Day.
Proven ability to get results
The MicroTime 200 has proven to be of great value to many researchers, as results obtained with it have played a significant role in more than 1000 publications to date.
What customers say about the MicroTime 200
"The system is SUPER, very stable, robust, and easy to handle. Simply, I enjoy working on it."
Hisham Mazal, The Haran Group, Weizmann Institute of Science, Israel
"First I would like to thank you for the quality of the MicroTime 200 FLIM microscope and software that provides amazing possibilities."
Geraud Delport, StranksLab, University of Cambridge, UK
"We have an extensive usage of our MicroTime 200, I would say almost 24/7."
Andrea Soranno, Department of Biochemistry and Molecular Biophysics, Washington University in St. Louis, USA
"In the last nearly 10 years the performance of this machine is outstanding."
Kankan Bhattacharyya, Indian Institute of Science Education & Research Bhopal
A selection of application examples
The MicroTime 200 is used world-wide by many scientists to tackle tough research challenges. We present here a selection of such application examples from various research fields:
- Dynamic structural biology
- Environmental sensing
- Liquid-liquid phase separation
- Membrane studies
- Advanced materials
Interested in more applications or examples? Do not hesitate to contact our application specialists.
Contact our Application Specialists
Dynamic structural biology
Slow Escape from a Helical Misfolded State of the Pore-Forming Toxin Cytolysin A
Dingfelder et al., JACS Au, 1, 8, 1217-1230 (2021)

What challenge did the researchers tackle?
The folding of small proteins is quite well studied and can be often approximated by a two-state mechanism. However, the majority of the proteome consists of large proteins that fold slowly and can be prone to misfolding and aggregation. Thus, the team of Benjamin Schuler chose to study cytolysin A (ClyA) as an example of a large protein with complex folding behavior.
Which tools and methods did they use?
The researchers chose single molecule FRET (smFRET) as their main tool, as it allows investigating the dynamics of non-native states on time scales from nanoseconds to hours. Furthermore, smFRET can identify individual conformational subpopulations and thus resolve structural and kinetic heterogeneity.
To investigate the folding kinetics of the ClyA monomer, they combined smFRET with a continuous-flow microfluidic mixing device. Nanosecond fluorescence correlation spectroscopy (nsFCS) was used to gather further evidence on the dynamics of the folding process.
What did they learn?
The team observed a complex folding process: the unfolded protein chain rapidly forms a highly collapsed intermediate, which converts very slowly to the native state. The nsFCS results did not indicate any chain reconfiguration dynamics.
In the folding intermediate, a lot of helical structures are already formed, but arranged in a compact globule-like state with slow dynamics, indicating pronounced non-native interactions.
The distance information gained from smFRET enabled them to assess the accuracy of molecular simulations. These had to be artificially biased to accelerate the simulation to cover the slow escape from the intermediate to the native state.
Allostery through DNA drives phenotype switching
Rosenblum et al., Nat Commun 12, 2967 (2021)

What challenge did the researchers tackle?
The function of proteins can be regulated by binding of ligands to regulatory sites. In some cases, the binding of one ligand at one site affects the ability of another ligand to bind at another, distal site, in a process called allostery. Information about the binding event is transmitted to the distal site by conformational changes of the protein.
Gabriel Rosenblum and colleagues set out to study whether DNA-mediated allostery upon transcription factor binding exists and whether it could be responsible for phenotype switching in the bacterium B. subtilis.
Which tools and methods did they use?
Single-molecule FRET (smFRET) proved to be a valuable tool for two reasons: First, one can retrieve from smFRET data absolute distance information in the range of 1 – 10 nm. Second, they could accurately derive the relative populations of free and ComK-bound DNA molecules, which show different FRET efficiencies. The researchers complemented these results with cryo-EM imaging of the ComK-DNA complex to check for DNA looping.
During their experiments, the scientists noted a strong aggregation tendency of ComK transcription factor. Therefore, they used dual-focus fluorescence correlation spectroscopy (2fFCS) to determine the Stokes radius and thereby the oligomeric state of ComK in solution and additionally to determine the thermodynamic stability of ComK under physiological conditions.
What did they learn?
By comparing distances obtained from smFRET data to values expected from DNA models, the researchers could establish a curved topology of the promoter DNA strands. This data also showed that signal transmission was achieved by mechanical deformation of the DNA strand, where binding of ComK to one binding site increased the affinity of the second binding site.
Additionally, the fraction of ComK-DNA complexes increased in a sigmoidal fashion with ComK concentrations only in the presence of the second binding site, proving a cooperative mode of binding. Cryo-EM imaging ruled out DNA looping and instead suggested DNA-mediated allostery as the source for the high binding cooperativity as well.
Environmental Sensing
Parathyroid hormone initiates dynamic NHERF1 phosphorylation cycling and conformational changes that regulate NPT2A-dependent phosphate transport
Zhang et al., J. Biol. Chem. 294(12) 4546–457 (2019)

What challenge did the researchers tackle?
Qiangmin Zhang and colleagues are interested in understanding how phosphate transport across the plasma membrane is regulated. It is known that the parathyroid hormone (PTH) controls phosphate transport, but the signaling mechanism between PTH, the sodium–phosphate co-transport protein 2A (NPT2A) and other players at the plasma membrane was unclear.
Which tools and methods did they use?
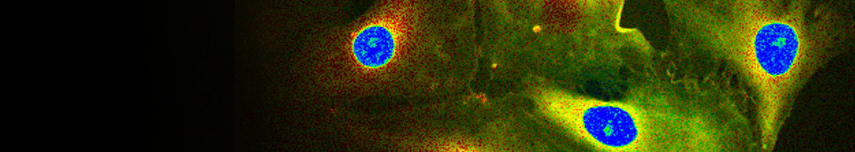
The researchers used a phosphate sensitive fluorophore (4-MeO-2-Me-TM) to observe intracellular phosphate concentration changes with time lapse fluorescence lifetime imaging (FLIM) in real time in living cells. These FLIM observations were complemented with mass spectrometry approaches to dentify phosphorylation sites and status of the proteins involved.
What did they learn?
Surprisingly, the FLIM data showed that PTH paradoxically and transiently elevated intracellular phosphate levels. Combining these results with mass spectroscopy indicated that phosphorylation regulates NHERF1 interactions with NPT2A to promote PTH-sensitive activity.
Mitochondrial pH Nanosensors for Metabolic Profiling of Breast Cancer Cell Lines
Ripoll et al., Int. J. Mol. Sci., 21, 3731 (2020)

What challenge did the researchers tackle?
Consuelo Ripoll and colleagues seek to understand the relationship between mitochondrial pH, tumoral metabolism, and cancer. To shed light on this, they designed a special nanosensor that accurately measures the intramitochondrial pH.
The sensor design is based on Quantum Dots (QDs) whose surfaces were modified with the pH-sensitive group MPA and Szeto-Shiller peptides for specific mitochondrial delivery. The QDs long fluorescence lifetime (5 to 100 ns) allow for easy discrimination from cellular autofluorescence (2 to 3 ns).
Which tools and methods did they use?
Fluorescence Lifetime Imaging (FLIM) was used as readout mechanism since it can serves as a quantitative read-out, which can be detected in real time in living cells. It is a robust parameter that is insensitive to experimental variables such as fluorophore concentration, excitation power, or scattering. The co-localization of the QDs with mitochondria was confirmed with dual-color FLIM.
What did they learn?
The researchers calibrated the QD`s response to pH and found a linear relationship between the average lifetime and the pH. With this in hand, they could measure the intramitochondrial pH in several cancer cell lines and indeed observed a correlation between pH values and drug-induced glycolytic collapse.
Liquid-liquid phase separation
α-Synuclein aggregation nucleates through liquid–liquid phase separation
Ray et al., Nat. Chem. 12, 705–716 (2020)

What challenge did the researchers tackle?
The protein α-synuclein (α-syn) is unstructured in its native state. But it can convert into an aggregated state and form cytotoxic amyloid fibrils, which are associated with Parkinson’s disease. Soumik Ray, Nitu Singh and colleagues used a multi pronged experimental and computational strategy to investigate early α-syn aggregation.
Which tools and methods did they use?
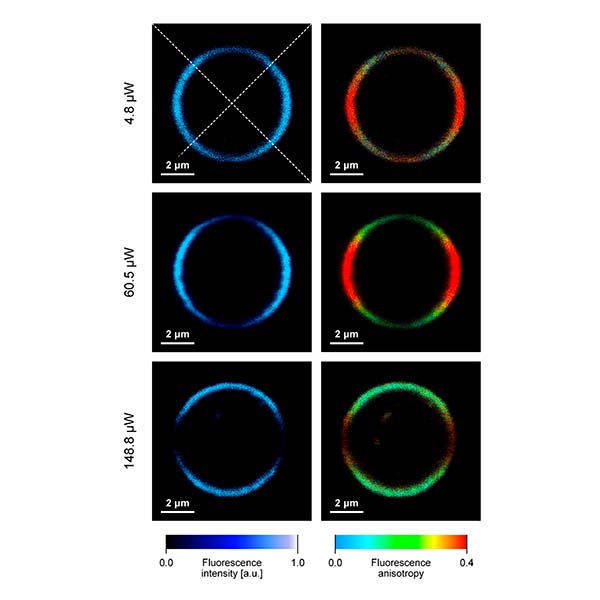
As a part of their strategy, they performed time-resolved fluorescence anisotropy decay measurements during α-syn liquid-liquid phase separation. Additionally, they performed FRAP (fluorescence recovery after photobleaching) measurements, which reports on the translational diffusion of α-syn in liquid droplets.
What did they learn?
The data collected from inside and outside α-syn droplets revealed the rotational motion of α-syn and thereby the increased rigidity of the molecules inside α-syn droplets compared to those outside. Droplets formed under different conditions and the aging of droplets over time could be observed.
In summary, the researchers showed that liquid-liquid phase separation of α-syn precedes its aggregation, and that α-syn liquid-like droplets undergo a liquid-to-solid transition on ageing.
The SARS-CoV-2 nucleocapsid protein is dynamic, disordered, and phase separates with RNA
Cubuk et al., Nat Commun 12, 1936 (2021)

What challenge did the researchers tackle?
Andrea Soranno and colleagues studied SARS-CoV-2 viruses with the goal of understanding virus protein function and finding potential drug targets. Specifically, they characterized the SARS-CoV-2 nucleocapsid (N) protein, which is responsible for viral genome packaging.
The flexible and dynamic N protein contains three intrinsically disordered domains, making conventional structural characterization very difficult.
Which tools and methods did they use?
To achieve this goal, the researchers combined smFRET and nsFCS to shed light on the protein’s conformational behavior. Besides revealing dynamic conformational behaviour, smFRET results can also be converted to chain dimensions by assuming the distribution of distances computed from polymer models.
To complement the experimental insights, the scientists performed all-atom simulations. The recovered inter-residue distances were in good agreement with those measured by smFRET.
Since the N protein can form dimers and higher-order oligomers, the scientists also used FCS diffusion measurements to confirm that the protein is indeed monomeric in the used concentration range.
What did they learn?
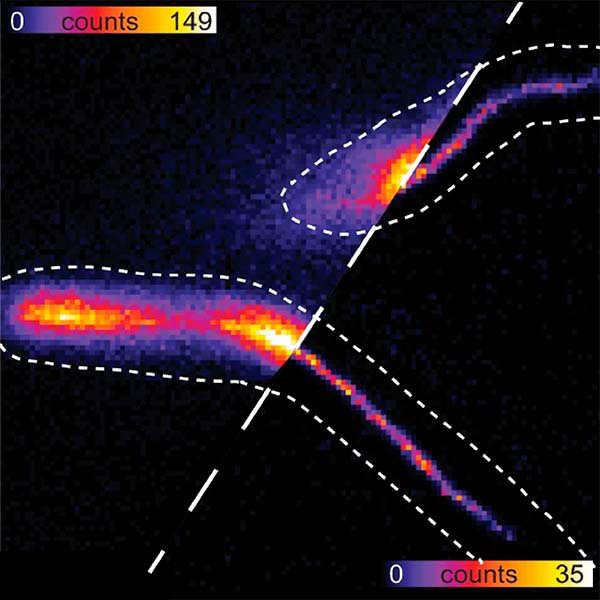
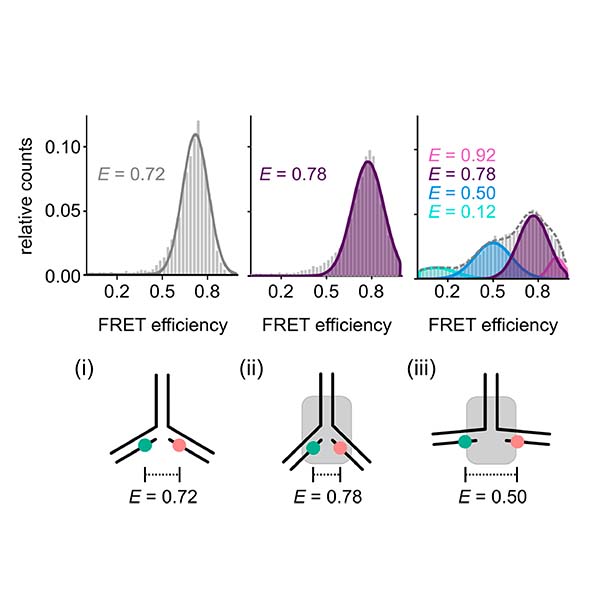
The presence of two or more peaks with different transfer efficiencies in the smFRET histograms can reveal the co-existence of several subpopulations with different conformations.
If only only a single peak is present, the question remains if it indicates a rigid distance – as would be the case for a folded protein – or if this represents a dynamic average across multiple conformations.
To resolve this question, the researchers plotted the observed transfer efficiency versus the fluorophores’ lifetimes. These turned out to lie on the line that represents fast conformational dynamics. For more quantitative results, the scientists turned to nsFCS, which yields the characteristic reconfiguration times of the protein chains.
Membrane dynamics and structure
Probing Colocalization of N-Ras and K-Ras4B Lipoproteins in Model Biomembranes
Li et al., ChemBioChem, 20, 1190 – 1195 (2019)

What challenge did the researchers tackle?
N-Ras and K-Ras4B are two signalling proteins bound to the cell membrane that play a major role in cancer. Lei Li and colleagues investigated if there is indeed cross-talk between the two proteins, as had been previously reported.
Which tools did they use?
FRET experiments using large unilamellar vesicles with added N-Ras and K-Ras4B were performed to check whether the two proteins come close to each other. For a closer look, the scientists turned to pulsed interleaved excitation fluorescence cross-correlation spectroscopy (PIE-FCCS), which reports if two labeled proteins diffuse together or independently. Additionally, AFM data was used to confirm their observations.
What did they learn?
The FRET experiments showed that both proteins do approach each other in the disordered membrane phase to a distance of less than 10 nm, but not very closely. PIE-FCCS results clearly showed that N-Ras does not co-diffuse with K-Ras4B, so a direct interaction can be ruled out. This agrees with AFM data, which showed that addition of N-Ras and K-Ras4B to the membrane caused changes in its lateral organization. So if there is a lipid-mediated cross-talk between both proteins, it turns out to be repulsive.
Unroofing site-specific α-synuclein–lipid interactions at the plasma membrane
Kaur et al., PNAS, vol. 117, 32, 18977–18983 (2020)
 What challenge did the researchers tackle?
While researchers know that the neuronal protein α-synuclein is associated with Parkinson`s disease, its physiological function in healthy organisms remains unclear. Evidence points to a role for α-synuclein in the regulation of synaptic vesicle fusion. Since this process takes place at the cell membrane, Upneet Kaur and Jennifer Lee investigated α-synuclein-lipid interactions.
Which tools and methods did they use?
For their experiments, they used unroofed cells instead of simple membrane mimics, which retain lipid complexity, native membrane–protein complexes, numerous vesicular structures, and the preserved cytoskeletal network.
In the cytosol, α-synuclein is intrinsically disordered. It adopts an α-helical structure upon membrane binding, but retains conformational plasticity. This is proposed to be biologically important, although it is not clear how.
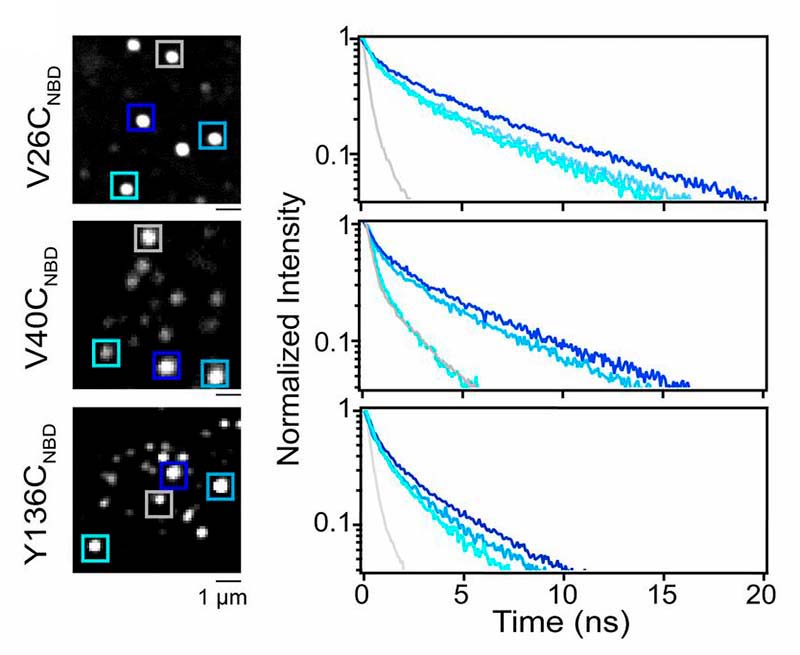
In order to study this conformational heterogeneity at the level of individual exocytic sites, the researchers used fluorescence lifetime imaging (FLIM) of the environmentally sensitive fluorophore NBD whose lifetime increases upon insertion into the hydrophobic lipid environment, thus acting as a membrane-binding reporter.
What did they learn?
By site-specific labeling of different residues of α-synuclein, the researchers could piece together a molecular picture of α-synuclein-membrane interactions, which revealed unexpected conformationally different subpopulations at different exocytic sites, that contradict current structural models.
Advanced materials
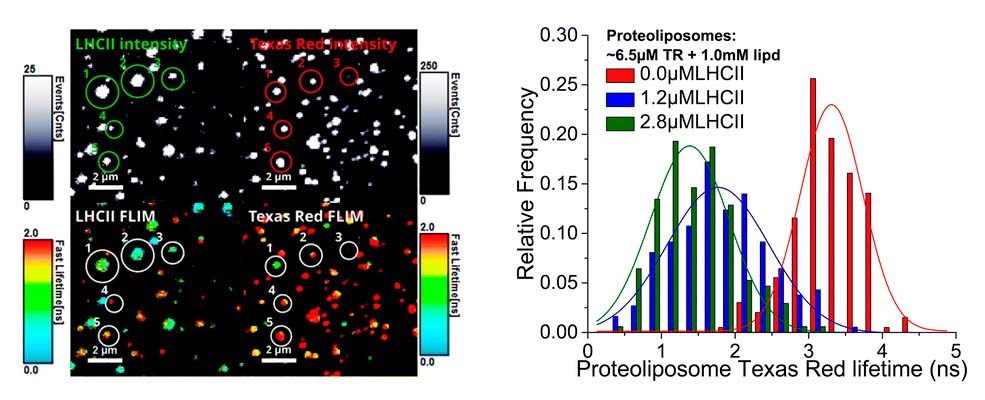
Proteoliposomes as energy transferring nanomaterials: enhancing the spectral range of light-harvesting proteins using lipid-linked chromophores
Hancock et al., Nanoscale, 11, 16284-16292 (2019)
What challenge did the researchers tackel?
Ashley Hancock and colleagues develop light-harvesting bio-hybrid nanomaterials. These are based on the Light-Harvesting Complex II (LHCII) protein from plants, which is embedded in a lipid membrane (proteoliposomes).
The LHCII has a high absorption coverage across the visible spectrum aside from the ‘green gap’. The researchers aim to fill this gap with lipid-tethered Texas Red (TR) chromophores, which is supposed to enhance the absorption range and transfer the energy to LHCII via Förster Resonance Energy Transfer (FRET), thereby increasing FRET efficiency.
Which tools and methods did they use?
The researchers measured FRET efficiency of proteoliposomes in bulk solution with ensemble time-resolved fluorescence spectroscopy across a range of protein and chromophore concentrations to optimize material composition. In addition, they used Fluorescence Lifetime Imaging microscopy (FLIM) to quantify the energy transfer efficiency on the level of individual particles.
What did they learn?
Microscopy of proteoliposomes verified that these retain their functionality when deposited onto a planar surface, which is important for future applications requiring thin films, e.g., in photo-active devices. The imaging of individual proteoliposomes showed a variation in energy transfer efficiency between individual proteoliposomes, which can serve as a measure for the quality of the self-assembly protocol.
Active Plasmonic Colloid-to-Film-Coupled Cavities for Tailored Light–Matter Interactions
Goßler et al., J. Phys. Chem. C, 123, 11, 6745–6752 (2019)

What challenge did the researchers tackle?
Fabian Goßler and colleagues design active plasmonic colloid-to-film-coupled cavities for use in novel optical circuits. The nanocavity's refractive index can be tailored across a wide wavelength range by using various materials, shapes, and cavity volumes. Specifically, they investigated gold nanospheres or silver nanocubes coupled to a gold film with ternary metal-chalcogenide quantum dots (QDs) sandwiched between colloid and film.
Which tools and methods did they use?
Fluorescence lifetime imaging (FLIM) allowed them to both probe the decay rates of individual nanocavities and to evaluate their variations statistically. The plasmon–exciton interaction, as a measure of the coupling strength, was confirmed by scattering spectroscopy, fluorescence lifetime measurements, and reversible refractive index sensing.
What did they learn?
Uncoupled QDs show an estimated average lifetime of 100 ns, while the metal-enhanced photoluminescent system shows a drastically decreased lifetime of about 330 ps. At the same time, the overall quantum efficiency of the QDs emission improves significantly, strongly increasing emission. Additionally, the TCSPC decay rate measurements of gold spheres and silver cubes were highly sensitive to the particle-to-film distance. Both improved emission and enhanced exciton decay indicate a strong interaction between plasmonic and excitonic components of the system.
Interested in more publications?
Contact our application specialists directly for more examples or search in our bibliography for further publications.
Contact our Application Specialists
A range of methods provides a multifaceted view of your sample
The MicroTime 200 provides access to a wide range of methods that can be used to gain deeper insights into many scientific questions. This section gives a short overview of them as well as what the MicroTime 200 offers.
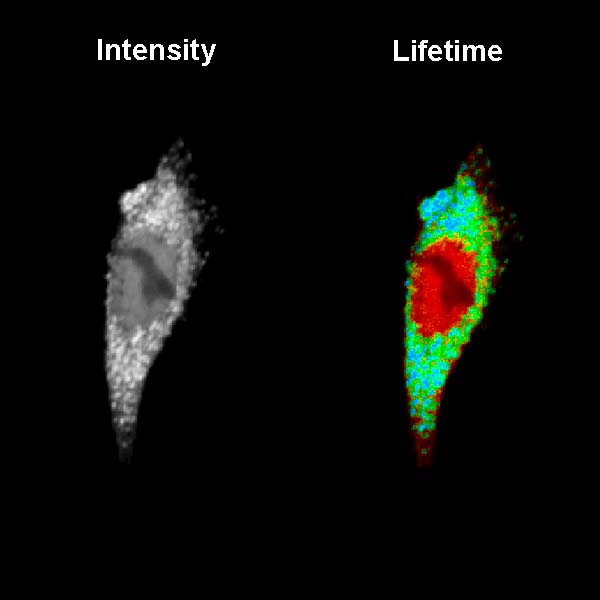
Fluorescence Lifetime Imaging (FLIM)
FLIM is a fluorescence imaging technique that resolves and displays the lifetimes of individual fluorophores rather than their emission spectra. The fluorescence lifetime is defined as the average time that a molecule remains in an excited state prior to returning to the ground state by emitting a photon. Since fluorescence lifetime is unrelated to concentration, absorption by the sample, sample thickness, photo-bleaching and/or excitation intensity it is less prone to artifacts than intensity based methods.

Benefits of FLIM:
- can be used to distinguish between fluorophores
- provides an additional dimension of information
- complementary to spectral information
- technique of choice for many kinds of functional imaging, as a fluorophore’s lifetime can be influenced by environmental parameters such as pH, ion or oxygen concentration, or molecular binding
The MicroTime 200 offers:
- combination of fast TCSPC data acquisition with high time resolution
- hardware and software designed for precise, quantitative measurements
Webinars on demand:
- Visualizing dynamic processes with rapidFLIM HiRes – the ultra fast FLIM imaging method with outstanding time resolution
- Environmental sensing with Fluorescence Lifetime Imaging (FLIM)
- How Fluorescence Lifetime Imaging (FLIM) can help you solve daily research challenges
FLIM-FRET – lifetime-based Förster resonance energy transfer
FRET is a non-radiative process whereby energy from an excited fluorescent molecule (donor) is transferred to a nearby non-excited fluorophore (acceptor) in the range of 2-10 nm. The energy transfer results in donor quenching and leads to changes in the fluorescence intensity of the tow fluorophores and a shortening of only the donor lifetime.
In contrast to standard FRET where one measures changes in fluorescence intensity, lifetime-based FRET enables quantitative analysis by using the fluorescence lifetime of the donor molecule as a probe, which is independent on concentration over a broad range. This is crucial since in biological systems like cells the fluorophore concentration often cannot be accurately determined and compared amongst different cells.
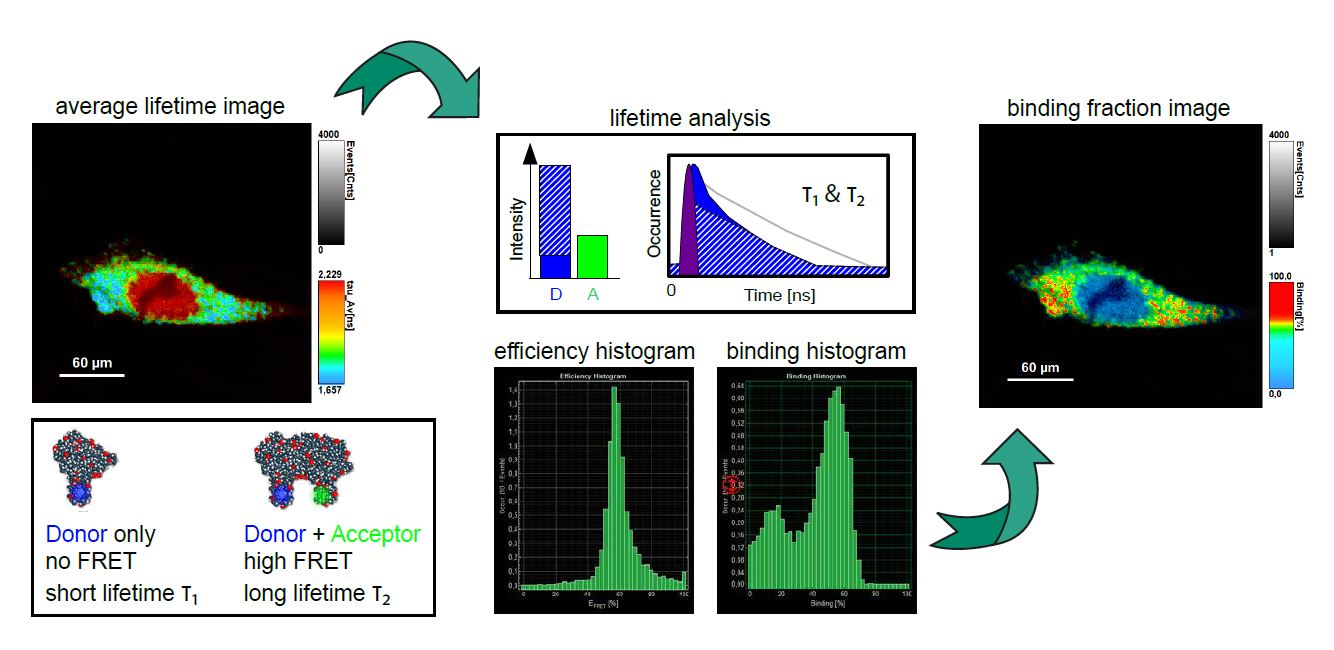
Benefits of FLIM-FRET: lifetime-based FRET can identify different sub populations with different FRET efficiencies, where intensity-based FRET would only detect the average value
The MicroTime 200 offers:
- configuration with several detectors can perform both intensity and lifetime-based FRETenabling comparison of results
- software that includes different FRET data analyis routines
- combines fast TCSPC data acquisition with high time resolution designed for precise, quantitative measurements
Application note:
smFRET – single-molecule Förster resonance energy transfer
In this type of experiments, the FRET process is observed within a single molecule (bearing a donor and acceptor), or between interacting partners that are either freely diffusing through the confocal volume immobilized on a surface.
A technique can be quite helpful in for smFRET is Pulsed Interleaved Excitation (PIE), where several pulsed lasers are synchronized. The laser pulses are separated on a nanosecond time scale to allow simultaneous recording of the temporal behaviour of a sample molecule corresponding to each individual laser.
In an smFRET experiment, this allows exciting the donor and acceptor alternately. In this way, the acceptor dye is excited independently of the FRET process to confirm its presence and photoactivity. Molecules lacking an active donor or acceptor are separated from active FRET complexes. This makes it possible to differentiate a FRET molecule, even with a very low FRET efficiency, from a molecule with an absent or non-fluorescing acceptor.
, or between interacting partners that are either freely diffusing through the confocal volume immobilized on a surface.")
The MicroTime 200 offers:
- proven single-molecule sensitivity
- highest time resolution
- easy implementation of Pulsed Interleaved Excitation (PIE) schemes for crosstalk correction and elimination of unrepresentative events
Webinars on demand:
- Probing the Dynamics and Interaction Mechanisms of Intrinsically Disordered Proteins with Single-Molecule Spectroscopy
- Functional studies of dysfunctional proteins
- Uncovering the conformational dynamics of intrinsically disordered proteins on the single molecule level
- Applications of single molecule FRET (smFRET) in structural biology
Fluorescence Correlation Spectroscopy (FCS)
Fluorescence Correlation Spectroscopy (FCS) is a correlation analysis of temporal fluctuations of the fluorescence intensity. It offers insights into the photophysics that cause these characteristic fluctuations as well as into the diffusion behavior and absolute concentrations of detected particles. FCS enables the determination of important biochemical parameters such as the concentration and size or shape of the particle (molecule) or viscosity of their environment.
 is a correlation analysis of temporal fluctuations of the fluorescence intensity.")
The MicroTime 200 offers:
- proven single-molecule sensitivity
- software including several analysis routines
Webinars on demand:
- Functional studies of dysfunctional proteins
- Uncovering the conformational dynamics of intrinsically disordered proteins on the single molecule level
- Scanning Fluorescence Correlation Spectroscopy and Super-resolution Microscopy on 2D Lipid Membranes
Application note:
Fluorescence Lifetime Correlation Spectroscopy (FLCS)
Fluorescence Lifetime Correlation Spectroscopy (FLCS), is a method that uses picosecond time-resolved fluorescence detection for separating different FCS contributions.
FLCS is of particular advantage when using spectrally inseperable fluorophores that differ in their lifetime for Fluorescence Cross-Correlation Spectroscopy (FCCS) because it offers elimination of spectral cross talk and background. It also offers a way around detector afterpulsing artifacts.
The MicroTime 200 offers:
- proven single-molecule sensitivity
- software including several analysis routines
Application note:
FCCS
Fluorescence Cross-Correlation Spectroscopy (FCCS) discriminates FCS signals from two different species based on their different emission spectra.
Anisotropy imaging
Measurement of steady-state and particularly time-resolved fluorescence anisotropy offers fascinating possibilities to study molecular orientation and mobility as well as processes that affect them. In general, anisotropy does not depend on the concentration of fluorophores, i.e. is independent of detected signal intensity. This is of particular importance for the interpretation of smFRET measurements where fluorophore mobility might affect the resonance transfer efficiency. Time-resolved anisotropy measurements are more informative, as steady-state ones only report time averaged values, without direct insight into the dynamics of the process.

The MicroTime 200 offers:
- up to 8 detectors for anisotropy in different spectral channels
- a detection unit design that allows switching between anisotropy and spectral detection mode
- software with powerful analytical routines
Technical note:
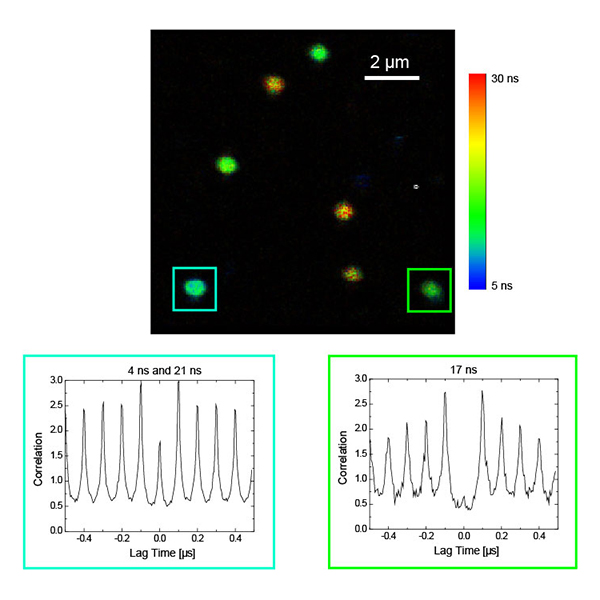
Photon antibunching/coincidence correlation
Observation of antibunching (by means of photon coincidence correlation or second-order correlation) can reveal whether there is only a single photon emitter present in a sample. The technique is very often employed for the characterization of single quantum systems such as single molecules, quantum dots, carbon nanotubes, and defect centers in diamond nanocrystals, or in applications based on single photon sources. Antibunching experiments can also reveal the degree of fluorophore multimerization.
 can reveal whether there is only a single photon emitter present in a sample.")
The MicroTime 200 offers:
- proven single-molecule sensitivity
- high time resolution
- up to 8 detectors for antibunching in different spectral channels
Webinar on demand:
Phosphorescence Lifetime Imaging (PLIM)
PLIM is similar to Fluorescence Lifetime Imaging (FLIM).The difference being the timescale of photon emission which takes place in the micro- to millisecond window in the case of phosphorescence rather than in the nano-second range, which is unique to fluorescence. Analogous to FLIM, the contrast in a PLIM image is based on the lifetime of individual fluorophores rather than their emission spectra.

The MicroTime 200 offers:
- capability of measuring lifetimes up to ms with high resolution (using a MultiHarp 150N)
- Sepia PDL 828 laser driver, which provides flexible settings for repetition rate, laser power, and burst mode
Webinars on demand
Technical notes
Time-Resolved Photoluminescence (TRPL) imaging
Time-Resolved Photoluminescence (TRPL) imaging is the tool of choice for studying fast electronic deactivation processes that result in the emission of photons.
Some species such as metal-organic complexes, inorganic crystal structures, semiconductors, and new types of hybrid materials have emission lifetimes ranging from nano- to micro- or even up to milliseconds.
Using TRPL imaging, charge carrier diffusion processes and the effect of localized inhomogeneities and defect sites can be identified, which brings an exceptional component to semiconductor analysis.
 imaging is the tool of choice for studying fast electronic deactivation processes that result in the emission of photons.")
The MicroTime 200 offers
- capability to measure lifetimes from ns to ms with high precision (using the MultiHarp 150)
- Sepia PDL 828 laser driver, which provides flexible settings for repetition rate, laser power, and burst mode
- uncommon laser excitation wavelengths upon request
Webinar on demand:
 Poster: Quick Reference for confocal time-resolved microscopy (FLIM, FRET, FCS)
A modular platform, capable of meeting challenging requirements
The MicroTime 200 contains all optics and electronics needed for recording most aspects of the fluorescence dynamics of samples with single molecule detection sensitivity. The platform’s exceptional sensitivity, flexibility, and unprecedented ease-of-use stem from a unique fusion of miniaturized and highly sophisticated state-of-the-art technologies.
A flexible excitation subsystem, well suited for many samples
 of the MicroTime 200")
The MicroTime 200 features a highly customizable excitation subsystem that can be adapted to requirements of many applications and sample types, such as most organic fluorophores, quantum dots and fluorescent proteins. The subsystem offers:
- Pulsed laser heads covering the spectral range from 375 to 900 nm with pulse widths below 100 picoseconds
- A versatile laser driver (Sepia PDL 828) allows addressing several lasers in parallel to generate complex excitation patterns, which enables advanced techniques such as Pulsed Interleaved Excitation (PIE). This technique can help increasing the specificity in single molecule FRET, Fluorescence Correlation Spectroscopy, FLIM, and STED super-resolution imaging.
- Optional support for excitation wavelengths as short as 255 nm, ideal for working with intrinsic fluorescence of aminoacids.
- The possibility for coupling Ti:Sa tunable lasers to enable multi-photon excitation schemes.
Detect your sample’s fluorescence with single photon sensitivity

The MicroTime 200 is specially designed for single molecule studies and thus offers unique optics with vastly reduced light absorption. The detection subsystem offers:
- Up to six individual detection channels, which can each be equipped with a different detector.
- A variety of single photon sensitive detectors, covering different wavelength ranges and detection efficiencies to match the detection requirements of your samples.
- Supports PicoQuant’s PMA Hybrid detectors, which offer high timing precision as well as negligible afterpulsing and dead times (ideal for rapidFLIM).
- A series of optimized SPADs from the PDM Series are also available, offering high detection efficiency.
A confocal microscopy system offering various scanning options

The MicroTime 200 can be equipped with different devices for scanning an image: A galvo scanner for quick image acquisition or piezo scanning devices for maximum flexibility in terms of usable wavelength ranges.
The FLIMbee galvo scanner: combining scan speed flexibility with high position precision
The core of the FLIMbee galvo scanner consists of three high precision oscillating mirrors with excellent linearity, repeatability and low drift.
- FLIMbee achieves extremely stable scanning speeds ranging from very slow to fast while maintaining high positioning precision.
- This high degree of flexibility in speed allows for applications ranging from Phosphorescence Lifetime Imaging (PLIM) to fast fluorescence lifetime measurements using rapidFLIM.
- The FLIMbee’s high positioning precision make it also optimally suited for super-resolution microscopy using STED, enabling imaging down to the single molecule level.
Piezo scanning: high precision with maximum flexibility in useable wavelength range
The MicroTime 200 can be equipped with an objective-scanning solution based on high precision piezo-scanner. This type of scanning is ideally suite for applications which require:
- Excitation light in UV region (255 to 375nm)
- Pixel sizes smaller than 10nm
- Measurements where extreme photon sensitivity matters
Timing electronics with picosecond time resolution and negligible dead time

Time-resolved microscopy requires not only the collection of photons themselves, but also determining their position in time and – for imaging – in space. The ideal technique for that purpose is the Time-Tagged Time-Resolved (TTTR) data acquisition mode developed by PicoQuant, a variation on the classic Time-Correlated Single Photon Counting (TCSPC). This acquisition mode offers the following advantages:
- A fundamental data format allows performing vastly different measurement procedures, such as FLIM, FCS or even coincidence correlation ("antibunching").
- The TTTR format is supported by all of PicoQuant’s TCSPC electronics.
- The format is also extensively documented and open to the community, simplifiying data transfer to various open source tools.
The MicroTime 200 uses either a MultiHarp 150P or a HydraHarp 400 for data acquisition. For applications requiring extremely high count rates, the MultiHarp 150P is more advantageous. If you aim to push the timing precision to the limit, then HydraHarp 400 is the preferred choice.
| MultiHarp 150P | HydraHarp 400 | |
|---|---|---|
| Number of detection channels | 4, 8, or 16 | 2. 4, 6, or 8 |
| Dead time | < 0.65 ns | < 80 ns |
| Max. sustainable count rate | 80 Mcounts per second | 40 Mcounts per second |
| Minimum time bin width | 5 ps | 1 ps |
The SymPhoTime 64 – an intuitive and powerful software for acquisition and analysis of time-resolved microscopy data

SymPhoTime 64 is the system software of the MicroTime 200 that handles all data collection, analysis, and visualization:
- All data handling in SymPhoTime 64 is fully transparent and maintains all originally collected and derived data in one workspace.
- A comprehensive log file helps to keep track of all measurement and analysis steps.
- Full data export available to standard formats compatible with external analysis tools.
Based on the sophisticated yet easy-to-use data collection and handling processes, the system software supports a multitude of methods, for example:
- Intensity time trace
- Burst analysis
- Lifetime histogramming
- Fluorescence Correlation Spectroscopy (FCS)
- Fluorescence Lifetime Correlation Spectroscopy (FLCS)
- Fluorescence Lifetime Imaging (FLIM)
- Förster Resonance Energy Transfer (FRET)
- Pattern matching analysis
- Fluorescence anisotropy
Download SymPhoTime 64 brochure
A variety of standard add-ons
The MicroTime 200 offers a wide variety of standard add-ons, which cover many aspects of single-molecule studies and imaging. Most of the add-ons listed below can be combined with each other, resulting in powerful systems capable of meeting the various research needs of your lab.
Super-resolution imaging via STED

Super-resolution STED imaging is now a well-established tool in molecular biology. Single molecules, cells, and tissue samples can be investigated using a wide variety of parameters, like emission color, polarisation, and fluorescence lifetime. With the MicroTime 200 STED, super-resolution FLIM images can be easily recorded. Additionally, the high scan speed of the FLIMbee galvo scanner helps in reducing phototoxicity and bleaching during STED imaging.
The MicroTime 200 STED add-on achieves a spatial resolution below 50 nm. The add-on has been designed to be highly robust and easy to use: It follows the “EasySTED principle”, which is based upon the insertion of a phase plate below the objective. Thus, STED microscopy can be performed without lengthy alignment procedures.
Combining the STED principle with time resolved single photon counting offers many possibilities:
- STED images with lower background and higher contrast via gated STED.
- As STED creates an effectively smaller observation volume, it can also be applied to other methods such as FCS. In this case, collecting data from different observation volumes can help to disentangle complex 2D diffusion scenarios in heterogeneous samples such as biological membranes.
- In combination with the Pulsed Interleaved Excitation (PIE) capabilities of the MicroTime, STED imaging can be performed using excitation wavelengths that are close to each other (i.e. 595. 640, and 660 nm). This allows imaging simultaneously up to 3 markers while using a single depletion beam.
Exemplary research using the MicroTime 200 STED microscope: The in vivo mechanics of the magnetotactic backbone as revealed by correlative FLIM-FRET and STED microscopy
Download MicroTime 200 STED brochure
Dual-focus FCS (2fFCS)
 two orthogonally polarized laser diodes, operated in a pulsed interleaved excitation (PIE) scheme are used to generate a robust dual-foci geometry.")
In dual-focus FCS (2fFCS) two orthogonally polarized laser diodes, operated in a pulsed interleaved excitation (PIE) scheme are used to generate a robust dual-foci geometry. The robust interfocal distance provides an intrinsic length scale to study diffusion in solution, which allows to overcome various uncertainties and limitations of single-focus FCS that arise because the analysis relies on knowledge of the size and shape of the confocal volume. This enables 2fFCS to dramatically improve the accuracy of measuring absolute diffusion coefficients.
PicoQuant is the only supplier of commercial, turn-key system capable of 2fFCS acquisition.
Application Note: Dual-Focus Fluorescence Correlation Spectroscopy
Exemplary research using the dual-focus FCS add-on:
- Allostery through DNA drives phenotype switching
- The Three-Fold Axis of the HIV-1 Capsid Lattice Is the Species-Specific Binding Interface for TRIM5α
Combination with AFMs
 with single-molecule-sensitive confocal fluorescence microscopy enables a fascinating investigation into the structure, dynamics and interactions of single molecules or their assemblies.")
The combination of atomic force microscopy (AFM) with single-molecule-sensitive confocal fluorescence microscopy enables a fascinating investigation into the structure, dynamics and interactions of single molecules or their assemblies. AFM reveals the structure of macromolecular complexes with nanometer resolution, while fluorescence can facilitate the identification of their constituent parts. In addition, nanophotonic effects, such as fluorescence quenching or enhancement due to the AFM tip, can be used to increase the optical resolution beyond the diffraction limit. For the first time, this development grants access to the effects of precise physical impact on biomaterials like cells and its effects simultaneously measured by fluorescence parameters. The combination of the MicroTime 200 with an AFM has currently been realized for three different AFMs:
- BioScope Catalyst: Bruker
- NanoWizard 4: JPK
- MFP-3D-BIO: Asylum research
Technical Notes:
- Combining the MicroTime 200 with the Bruker BioScope Catalyst AFM for Multiparameter Cell Imaging
- Combining Atomic Force Microscopy with Confocal Microscopy
Exemplary research using an AFM in combination with the MicroTime 200: Model Lipid Membranes Assembled from Natural Plant Thylakoids into 2D Microarray Patterns as a Platform to Assess the Organization and Photophysics of Light-Harvesting Proteins
AFM-FLIM set-up
The Martin-Fabiani Group at Loughborough University UK installed and commissioned an integrated Bruker AFM and a MicroTime 200 in September 2021 in a new AFM-FLIM facility. Watch the video to learn more about the new AFM-FLIM set-up.
Spectrograph add-on
 along with a single molecule sensitive CCD camera to the MicroTime 200 opens up new prospects in the investigations of single molecules.") Adding a spectrograph (SR-163 from Andor) along with a single molecule sensitive CCD camera to the MicroTime 200 opens up new prospects in the investigations of single molecules. The spectrograph is attached via a multimode fibre to an exit port of the main optical unit of the MicroTime 200. Inside the main optical unit, a suitable optical element is used to direct a defined part of the emitted light towards the exit port. An easy exchange of the optical element (100% mirror, 50/50 beamsplitter, ...) allows for the customization of the experimental conditions. Depending on the context of the experiment, a defined part of the fluorescence is utilized to acquire the spectral information. Intensity fluctuations, fluorescence decay properties and spectral data of a single molecule can be obtained simultaneously. Both, the observation of spectral changes as a function of time, and the comparison of spectra from different molecules are possible with this combination.
Adding a spectrograph (SR-163 from Andor) along with a single molecule sensitive CCD camera to the MicroTime 200 opens up new prospects in the investigations of single molecules. The spectrograph is attached via a multimode fibre to an exit port of the main optical unit of the MicroTime 200. Inside the main optical unit, a suitable optical element is used to direct a defined part of the emitted light towards the exit port. An easy exchange of the optical element (100% mirror, 50/50 beamsplitter, ...) allows for the customization of the experimental conditions. Depending on the context of the experiment, a defined part of the fluorescence is utilized to acquire the spectral information. Intensity fluctuations, fluorescence decay properties and spectral data of a single molecule can be obtained simultaneously. Both, the observation of spectral changes as a function of time, and the comparison of spectra from different molecules are possible with this combination.
Technical Note:
Further interest in combining time-resolved measurements with spectral detection? Also check the customization highlights or contact our experts.
Exemplary research using a spectograph coupled to the MicroTime 200:
- Preprocess dependence of optical properties of ensembles and single siphonaxanthin-containing major antenna from the marine green alga Codium fragile
- Wavelength-Dependent Optical Response of Single Photosynthetic Antenna Complexes from Siphonous Green Alga Codium fragile
Two-Photon-Excitation unit

The main optical unit of the MicroTime 200 can be equipped with an additional set of opto-mechanical and electrical components for coupling an external laser, which includes bringing the laser beam to the correct height, expanding it for focused excitation, and providing a synchronization signal that can be processed by the TCSPC electronics. The optics are pre-aligned by PicoQuant, and re-alignment can be performed by the user, should it be necessary. Inside the TPE unit, the laser beam is fully enclosed to ensure the user's safety.
Applications of two-photon excitation include deep-tissue imaging and time-resolved photo-luminescence in materials science.
Technical Note:
UV upgrade

The UV upgrade for the MicroTime 200 grants direct access to the native fluorescence of biomolecules originating from naturally occurring chromophoric groups such as tyrosine or tryptophane, enabling “label-free FLIM”. The UV upgrade uses a laser emitting at 266 nm along with UV sensitive PMT detectors and quartz optics, which enables measuring fluorescence lifetimes and FLIM. Note that detection of fluorescence in the visible range is still available.
Technical Note:
Do not hesitate to contact us if you have any questions about our add-ons or their combination potential. We are always happy to discuss your research requirements.
A selection of customized MicroTime 200 systems
Thanks to its open and modular design, the MicroTime 200 can be connected to or combined with many components or instruments, even from third parties. Here, we showcase a few examples of how a MicroTime 200 was tailored to a research group’s needs and what type of novel or combined experiments it enables them to perform.
Does your research call for a time-resolved microscope with special capabilities? Then feel free to contact us. We are always happy to discuss your customization requirements.
Characterization of new functional materials with fluorescence and phosphorescence lifetime imaging in the VIS and NIR range, correlated with atomic force microscopy
Customer: Ignacio Martin-Fabiani, Loughborough University, Department of Materials, UK
Research focus
- Diffusion and self-assembly in aqueous colloidal blends – bimodal, trimodal, and polydisperse.
- Design, fabrication, and testing of functional polymer and composite coatings, including antibacterial, self-cleaning, and abrasion resistant.
- Combination of atomic force microscopy with high-end optical microscopies for materials characterisation, including confocal fluorescence lifetime imaging microscopy.
 Configuration of the customized instrument
- excitation lasers: 405, 485, 530, 640 nm
- microscope body: Olympus IX73
- 3D piezo scanning
- coupling with AFM Bruker BioScope Resolve
- detectors: two Excelitas SPADs, two PMA Hybrid-40
- exit port, fiber-coupled with NIR PMT
- TCSPC electronics: HydraHarp 400, MultiHarp 150, and MultiHarp 150 4N
This set-up enables the following novel experiments
- correlated imaging with AFM and FLIM
- fluorescence imaging in the near infrared (NIR)
- Phosphorescence Lifetime Imaging (PLIM) using the MultiHarp 150 4N
Single- and multi-photon excitation of newly developed (photo)functional compounds and time-resolved spectral imaging of their fluorescence by coupling microscope and spectrometer
Customer: Cristian Strassert, Center for Nanotechnology, WWU Muenster, Germany
Research focus
By exploring the fundamental aspects of the light/matter interaction, the Strassert Lab is dedicated to the synthesis, engineering, and processing of (photo)functional coordination compounds towards innovative (nano)materials and tailored instrumental methods supported by theory. These tools are implemented for the optical manipulation of structural features and dynamic processes in living systems and as dual probes for high-resolution multimodal imaging, acting simultaneously as contrast agents for electron microscopy and as phosphorescent markers for spatially and temporally resolved luminescence micro(spectro)scopy.
- Coordination Chemistry and Functional Imaging
- Interaction between light and matter at the molecular level
- Engineering of tailored materials and instrumental methods
functional compounds and time-resolved spectral imaging of their fluorescence by coupling microscope and spectrometer") Configuration of the customized instrument:
Configuration of the customized instrument:
- excitation lasers: 375, 405, 440, 532, and 640 nm
- coupling with a Spectra Physics MAI TAI multiphoton excitation laser, equipped with APE double pulse picker
- microscope body: Olympus IX73
- FLIMbee galvo scanner and widerange scanner
- detectors: one Excelitas SPAD, one PMA Hybrid-40
- TCSPC electronics: MultiHarp 150
- combined with a spectrograph Andor SR163
- combination with a FluoTime 300 high performance time-resolved and steady state spectrometer
The FluoTime 300 can be used as a stand-alone spectrometer as well as in combination with the MicroTime 200 to measure with high spatial resolution decays, emission scans and TRES (time-resolved emission scans)
Configuration FluoTime 300:
- excitation with pulsed light sources 310, 375, 405, 640 and 980 nm
- double Monochromator switchable from additive to subtractive mode in emission
- HPD 07 and NIR PMT 1400 single channel detection
- CW add-on with 300W and flash lamp excitation and double monochromator
- sample holders: four position sample changer, front face sample holders for solids, liquid nitrogen cryostat, integrated sphere
This set-up enables the following novel experiments
- multiphoton excitation of sample, detection with FluoTime 300 → spatially, temporally and spectrally resolved detection of fluorescence
- spectral imaging with MicroTime 200 and Andor spectrograph
- PLIM capability (Phosphorescence Lifetime Imaging)
Visualizing single molecule dynamics under cryogenic conditions and at room temperature with spectrally and temporally resolved fluorescence detection
Customer: Gilad Haran, Weizmann Institute of Sciences, Israel
Research focus
 Haran’s research involves the application of cutting-edge spectroscopic methods on the single-molecule level, including fluorescence and Raman scattering, to study molecular dynamics. His group is interested in a diverse set of challenges ranging from protein folding to surface plasmon antennas.
- conformational changes with smFRET
- plasmon-exciton coupling
Configuration of the customized instrument
- excitation lasers: 485, 560, 595, 690, and 730 nm
- microscope body: Olympus IX83
- 3D piezo scanning
- Attocube cryostat, parallel to MicroTime 200
- detectors: 4 Excelitas SPADs
- detection set-up enables anisotropy and antibunching measurements
- spectrograph, receiving emitted light from cryostat
- TCSPC electronics: HydraHarp 400
This set-up enables the following novel experiments
- highest sensitivity 4-channel free space detection of single molecule fluorescence under cryogenic conditions
Relevant publications
- Mazal, Hisham, et al. "Ultrafast pore-loop dynamics in a AAA+ machine point to a Brownian-ratchet mechanism for protein translocation." Science advances 7.36 (2021): eabg4674.
- Gupta, Satyendra Nath, et al. "Complex plasmon-exciton dynamics revealed through quantum dot light emission in a nanocavity." Nature communications 12.1 (2021): 1-9.
Recording charge carrier diffusion with static or scanning single- and multi-photon excitation at cryogenic or room temperature
Customer: Sam Stranks, University of Cambridge, Cavendish Laboratory, UK
Research focus
The research interests of Sam Stranks’ group are centered on the optoelectronic properties of emerging semiconductors including halide perovskites, organic materials and inorganic structures with a focus on next generation light harvesting (PV) and light emitting devices (LED, LASERS). The researchers are particularly interested in how the local charge carrier recombination varies spatially and relates to local chemical, structural and morphological features.
- Characterizing semiconductor-based light harvesting and light emitting devices
- Quantifying critical physical parameters of emerging semiconductors including the concentration of defects, luminescence quantum yields or carrier diffusion coefficients
 Configuration of the customized instrument
- excitation lasers: 405, 510, and 640 nm
- multiphoton excitation with Insight DS+ laser
- microscope body: Olympus IX73
- microscope modified for illumination through the back port
- cryostat
- FLIMbee galvo scanner
- detectors: Excelitas SPAD and PMA Hybrid-42
- fiber-coupled Andor Kymera 193 spectrograph
- TCSPC electronics: TimeHarp 260 pico and nano
This set-up enables the following novel experiments
Recording of „diffusion maps“ by exciting in one spot through back port and then scanning detection volume to acquire time-resolved image.
Relevant publications
- Li, Z., Bretscher, H., Zhang, Y. et al. Mechanistic insight into the chemical treatments of monolayer transition metal disulfides for photoluminescence enhancement. Nat Commun 12, 6044 (2021). https://doi.org/10.1038/s41467-021-26340-6
- Halide Mixing and Phase Segregation in Cs2AgBiX6 (X = Cl, Br, and I) Double Perovskites from Cesium-133 Solid-State NMR and Optical Spectroscopy
Dominik J. Kubicki, Marcin Saski, Stuart MacPherson, Krzysztof Gal̷kowski, Janusz Lewiński, Daniel Prochowicz, Jeremy J. Titman, and Samuel D. Stranks
Chemistry of Materials 2020 32 (19), 8129-8138
DOI: 10.1021/acs.chemmater.0c01255 - Rational Passivation of Sulfur Vacancy Defects in Two-Dimensional Transition Metal Dichalcogenides
Hope Bretscher, Zhaojun Li, James Xiao, Diana Yuan Qiu, Sivan Refaely-Abramson, Jack A. Alexander-Webber, Arelo Tanoh, Ye Fan, Géraud Delport, Cyan A. Williams, Samuel D. Stranks, Stephan Hofmann, Jeffrey B. Neaton, Steven G. Louie, and Akshay Rao
ACS Nano 2021 15 (5), 8780-8789
DOI: 10.1021/acsnano.1c01220 - Ruggeri, Edoardo, et al. "Controlling the Growth Kinetics and Optoelectronic Properties of 2D/3D Lead–Tin Perovskite Heterojunctions." Advanced Materials 31.51 (2019): 1905247.
Our highly qualified support team

You will profit from the combined expertise of our support team. All supporters hold a PhD degree in the natural sciences. Tab into their years of experience to advance your research!
Our support team offers:
- system installation and initial training with hardware and software, either on-site or remote
- follow-up training on demand, tailored to your needs
- application counseling regarding questions from sample preparation and measurement setting optimization to data analysis
- troubleshooting in case of microscope hardware and software problem
- system repairs
 Scientific guidance and user training

PicoQuant annually holds the European short course on "Time-resolved Microscopy and Correlation Spectroscopy". The course is intended for individuals wishing an in-depth introduction to the principles of time-resolved fluorescence microscopy and its applications to the Life Sciences. This 3-day event consists of lectures as well as instrumentation and software hands-on training.
Demonstrations and test measurements
The team also performs instrument demonstrations and test measurements with your samples in our application lab in Berlin. If you want to find out what the MicroTime 200 can reveal about your samples, request a demo or test measurements
Request demo and test measurements
What customers say about our support
"Fantastic support. This is one of the main reasons for me to purchase PicoQuant equipment and recommend it to colleagues! Please keep this service always."
Prof. Dominik Wöll, RWTH Aachen University, Germany
"I'm very glad to have the opportunity to work with PicoQuant instrument and to have the support of a strong experienced team in time-resolved fluorescence to explore new horizons."
Arnaud Spangenberg, Institut des Science de Matériaux de Mulhouse, Bâtiment CNRS, France
"I was so excited when I aligned my first STED doughnut and imaged a nanoruler! Thanks to the awesome virtual training from Olaf and Denis from the PicoQuant support team."
Dr. Joëlle Goulding, University of Nottingham, UK
"I am a user of a MicroTime 200 at the University of Zaragoza, Spain. First of all, let me thank you for your previous support on other issues. I must say I am very satisfied with your instrument and the support team."
Pablo Garcia, University of Zaragoza, Spain